Area Overview for B90 2PE
Photos of B90 2PE

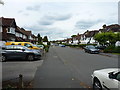
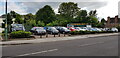
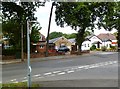

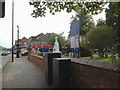
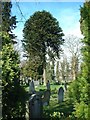
21 photos from this area
Area Information
Key information about the B90 2PE including its size, population, and administrative classification.
- Area Type
- Postcode
- Area Size
- 1.9 hectares
- Population
- 1666
- Population Density
- 4939 people/km²
House Prices in B90 2PE
36
Properties
£341,177
Average Sold Price
£1,420
Lowest Price
£592,000
Highest Price
Showing 36 properties
| Address | Type | Beds | Baths | Last Sale Price | Last Sale Date | |
|---|---|---|---|---|---|---|
| 67 Bills Lane, Shirley, Solihull, B90 2PE | house | - | - | £510,000 | Feb 2024 | |
| 71 Bills Lane, Shirley, Solihull, B90 2PE | Retail | 4 | 2 | £592,000 | Dec 2022 | |
| 65 Bills Lane, Shirley, Solihull, B90 2PE | Detached | 3 | 1 | £579,950 | Oct 2022 | |
| 62 Bills Lane, Shirley, Solihull, B90 2PE | house | - | - | £568,000 | Mar 2022 | |
| 76 Bills Lane, Shirley, Solihull, B90 2PE | house | - | - | £400,000 | Dec 2021 | |
| 66 Bills Lane, Shirley, Solihull, B90 2PE | Detached | 2 | 1 | £310,000 | Nov 2021 | |
| 88 Bills Lane, Shirley, Solihull, B90 2PE | house | 3 | - | £377,750 | Sep 2021 | |
| 61 Bills Lane, Shirley, Solihull, B90 2PE | Detached | 4 | 2 | £1,420 | Jun 2021 | |
| 84 Bills Lane, Shirley, Solihull, B90 2PE | house | - | - | £385,000 | Feb 2021 | |
| 77 Bills Lane, Shirley, Solihull, B90 2PE | Detached | 4 | 1 | £444,000 | Feb 2020 |
Page 1 of 4
Energy Efficiency in B90 2PE
Amenities
Schools
| Rank | School | Type | Entry gender | Ages |
|---|
Explore more schools in this area
Go to Schools tabDemographics
Household Size
Family (3-5 people)
most common
Accommodation Type
Houses
most common
Tenure
87
majority
Ethnic Group
White
most common
Religion
N/A
most common
Household Composition
N/A
most common
Age
47
median
Adults (30-64 years)
most common
Household Deprivation
N/A
with no deprivation
NS-SEC
41
in Lower managerial occupations
Explore more demographic insights in this area
Go to Demographics tabPlanning
Planning Constraints
- Flood RiskPremium
- Ramsar Wetland SitesPremium
- Area of Outstanding Natural BeautyPremium
- Protected Nature ReservePremium
- Protected WoodlandPremium