Area Overview for B90 2AN
Photos of B90 2AN

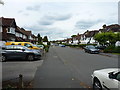
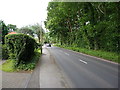
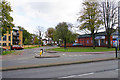

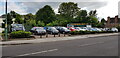
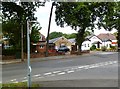

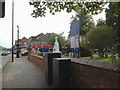


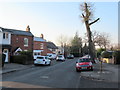
21 photos from this area
Area Information
Key information about the B90 2AN including its size, population, and administrative classification.
- Area Type
- Postcode
- Area Size
- 2.0 hectares
- Population
- 1574
- Population Density
- 4672 people/km²
House Prices in B90 2AN
35
Properties
£377,313
Average Sold Price
£106,000
Lowest Price
£560,000
Highest Price
Showing 35 properties
| Address | Type | Beds | Baths | Last Sale Price | Last Sale Date | |
|---|---|---|---|---|---|---|
| 67 Shakespeare Drive, Shirley, Solihull, B90 2AN | house | - | - | £505,000 | Jun 2021 | |
| 65 Shakespeare Drive, Shirley, Solihull, B90 2AN | Detached | 6 | 3 | £560,000 | Jan 2021 | |
| 73 Shakespeare Drive, Shirley, Solihull, B90 2AN | Detached | 4 | 1 | £494,000 | Aug 2020 | |
| 42 Shakespeare Drive, Shirley, Solihull, B90 2AN | Detached | 5 | 3 | £555,000 | Jul 2020 | |
| 51 Shakespeare Drive, Shirley, Solihull, B90 2AN | house | - | - | £412,500 | Feb 2018 | |
| 61 Shakespeare Drive, Shirley, Solihull, B90 2AN | Detached | 4 | 2 | £520,000 | Jul 2017 | |
| 49 Shakespeare Drive, Shirley, Solihull, B90 2AN | Detached | 5 | 3 | £450,000 | Jun 2017 | |
| 38 Shakespeare Drive, Shirley, Solihull, B90 2AN | Detached | 4 | 2 | £412,500 | Oct 2015 | |
| 53 Shakespeare Drive, Shirley, Solihull, B90 2AN | Detached | 4 | 3 | £385,000 | Aug 2014 | |
| 71 Shakespeare Drive, Shirley, Solihull, B90 2AN | Detached | 4 | - | £330,000 | Nov 2012 |
Page 1 of 4
Energy Efficiency in B90 2AN
Amenities
Schools
| Rank | School | Type | Entry gender | Ages |
|---|
Explore more schools in this area
Go to Schools tabDemographics
Household Size
Family (3-5 people)
most common
Accommodation Type
Houses
most common
Tenure
91
majority
Ethnic Group
White
most common
Religion
N/A
most common
Household Composition
N/A
most common
Age
47
median
Adults (30-64 years)
most common
Household Deprivation
N/A
with no deprivation
NS-SEC
43
in Lower managerial occupations
Explore more demographic insights in this area
Go to Demographics tabPlanning
Planning Constraints
- Flood RiskPremium
- Ramsar Wetland SitesPremium
- Area of Outstanding Natural BeautyPremium
- Protected Nature ReservePremium
- Protected WoodlandPremium