Area Overview for B18 7LZ
Photos of B18 7LZ
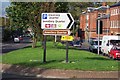
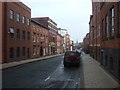
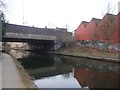
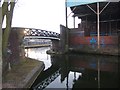
100 photos from this area
Area Information
Key information about the B18 7LZ including its size, population, and administrative classification.
- Area Type
- Postcode
- Area Size
- 1.7 hectares
- Population
- 1581
- Population Density
- 4240 people/km²
House Prices in B18 7LZ
36
Properties
£130,721
Average Sold Price
£34,500
Lowest Price
£210,000
Highest Price
Showing 36 properties
| Address | Type | Beds | Baths | Last Sale Price | Last Sale Date | |
|---|---|---|---|---|---|---|
| 125 New Spring Street, Birmingham, B18 7LZ | Terraced | 2 | 2 | £190,000 | Mar 2025 | |
| 95 New Spring Street, Birmingham, B18 7LZ | house | - | - | £210,000 | Sep 2024 | |
| 116 New Spring Street, Birmingham, B18 7LZ | house | - | - | £185,000 | May 2022 | |
| 117 New Spring Street, Birmingham, B18 7LZ | Terraced | 2 | 1 | £110,000 | Apr 2022 | |
| 111 New Spring Street, Birmingham, B18 7LZ | Terraced | 2 | - | £168,000 | Jun 2021 | |
| 99 New Spring Street, Birmingham, B18 7LZ | house | - | - | £180,000 | Jul 2020 | |
| 127 New Spring Street, Birmingham, B18 7LZ | house | - | - | £110,000 | Jun 2020 | |
| 113 New Spring Street, Birmingham, B18 7LZ | Terraced | 3 | 2 | £135,000 | Jun 2019 | |
| 124 New Spring Street, Birmingham, B18 7LZ | Terraced | 3 | 1 | £170,000 | Apr 2019 | |
| 92 New Spring Street, Birmingham, B18 7LZ | Terraced | 1 | 2 | £156,700 | Feb 2016 |
Page 1 of 4
Energy Efficiency in B18 7LZ
Amenities
Schools
| Rank | School | Type | Entry gender | Ages |
|---|
Explore more schools in this area
Go to Schools tabDemographics
Household Size
Family (3-5 people)
most common
Accommodation Type
Houses
most common
Tenure
29
majority
Ethnic Group
black_total
most common
Religion
N/A
most common
Household Composition
N/A
most common
Age
47
median
Adults (30-64 years)
most common
Household Deprivation
N/A
with no deprivation
NS-SEC
15
in Lower managerial occupations
Explore more demographic insights in this area
Go to Demographics tabPlanning
Planning Constraints
- Flood RiskPremium
- Ramsar Wetland SitesPremium
- Area of Outstanding Natural BeautyPremium
- Protected Nature ReservePremium
- Protected WoodlandPremium