Area Overview for SO19 7JN
Photos of SO19 7JN
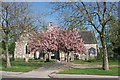
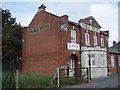
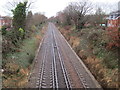
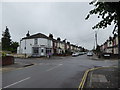
66 photos from this area
Area Information
Key information about the SO19 7JN including its size, population, and administrative classification.
- Area Type
- Postcode
- Area Size
- 4.6 hectares
- Population
- 1864
- Population Density
- 4001 people/km²
House Prices in SO19 7JN
54
Properties
£226,126
Average Sold Price
£35,000
Lowest Price
£522,000
Highest Price
Showing 54 properties
| Address | Type | Beds | Baths | Last Sale Price | Last Sale Date | |
|---|---|---|---|---|---|---|
| 33 Peartree Avenue, Southampton, SO19 7JN | Semi-detached | 3 | 2 | £350,000 | Dec 2023 | |
| 59 Peartree Avenue, Southampton, SO19 7JN | Detached | 3 | 1 | £390,000 | Nov 2023 | |
| 19 Peartree Avenue, Southampton, SO19 7JN | Semi-detached | 3 | 1 | £327,000 | Aug 2022 | |
| 23 Peartree Avenue, Southampton, SO19 7JN | Retail | 3 | 1 | £330,000 | Apr 2022 | |
| 81 Peartree Avenue, Southampton, SO19 7JN | Detached | 3 | 1 | £522,000 | Feb 2022 | |
| 35 Peartree Avenue, Southampton, SO19 7JN | house | - | - | £365,700 | Oct 2021 | |
| 5 Peartree Avenue, Southampton, SO19 7JN | Detached | 2 | 1 | £215,000 | Aug 2021 | |
| 79B Peartree Avenue, Southampton, SO19 7JN | Flat | - | - | £142,000 | Jun 2021 | |
| 57 Peartree Avenue, Southampton, SO19 7JN | house | - | - | £310,000 | Dec 2020 | |
| 29 Peartree Avenue, Southampton, SO19 7JN | Detached | 3 | - | £305,000 | Jun 2020 |
Page 1 of 6
Energy Efficiency in SO19 7JN
Amenities
Schools
| Rank | School | Type | Entry gender | Ages |
|---|
Explore more schools in this area
Go to Schools tabDemographics
Household Size
One person
most common
Accommodation Type
Flats
most common
Tenure
34
majority
Ethnic Group
White
most common
Religion
N/A
most common
Household Composition
N/A
most common
Age
47
median
Adults (30-64 years)
most common
Household Deprivation
N/A
with no deprivation
NS-SEC
20
in Lower managerial occupations
Explore more demographic insights in this area
Go to Demographics tabPlanning
Planning Constraints
- Flood RiskPremium
- Ramsar Wetland SitesPremium
- Area of Outstanding Natural BeautyPremium
- Protected Nature ReservePremium
- Protected WoodlandPremium