Area Overview for SE12 9PH
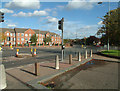
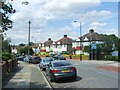
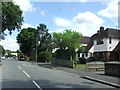
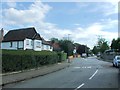
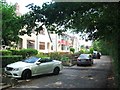
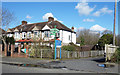
Photos of SE12 9PH


Area Information
SE12 9PH represents a specific residential cluster within South East London, characterised by a tightly knit community of just 1,643 residents. This small area occupies only 2.3 hectares, creating a dense environment where the population density reaches 71,208 people per square kilometre. Living in SE12 9PH means navigating a space where every plot is likely occupied, fostering an intimate neighbours' network. The postcode covers a small residential cluster that feels expansive only in the deepest sense of domestic privacy, as the physical footprint remains minimal. Prospective buyers should understand that this is not a sprawling suburb but a concentrated settlement where local life revolves around immediate proximity. The area functions as a distinct micro-community within the wider Lewisham Grove and Greenwich peninsula. Daily life here involves a trade-off between the convenience of living close together and the lack of open rural land within the immediate boundary. For anyone considering homes in SE12 9PH, the reality is a fully populated zone where noise and activity are inherent to the land use. You will find yourself surrounded by households rather than isolated sprawl. This density defines the character of the postcode, ensuring that no location is truly remote from another within the boundary.
- Area Type
- Postcode
- Area Size
- 2.3 hectares
- Population
- 1643
- Population Density
- 7232 people/km²
The housing stock in SE12 9PH is defined by a strong preference for detached and semi-detached dwellings rather than apartments. With houses forming the primary accommodation type, the area offers a suburban feel distinct from high-density urban zones. Home ownership stands at 52%, which indicates that slightly more than half of the residents have purchased their property outright or via mortgage. This figure suggests a market where buying is common, yet renters still constitute a significant portion of the population. Prospective buyers looking at SE12 9PH should expect a landscape of traditional residential clusters rather than converted lofts or large blocks of flats. The concentration of houses aligns with the area's classification as a residential cluster covering 2.3 hectares. This mix implies a market with established long-term residents who chose to buy, alongside those who prefer the flexibility of tenancy. If you are considering homes in SE12 9PH, the data confirms a property market where conventional housing structures dominate. The 52% ownership rate means you will interact frequently with owner-occupiers who treat their property as a lasting investment. There is no evidence of luxury or ultra-prime pricing in the raw data, but the house-dominant stock suggests a standard middle-market character.
House Prices in SE12 9PH
Showing 23 properties
| Address | Type | Beds | Baths | Last Sale Price | Last Sale Date | |
|---|---|---|---|---|---|---|
| 89 Marvels Lane, Grove Park, London, SE12 9PH | Semi-detached | 3 | 1 | £575,000 | Mar 2025 | |
| 81 Marvels Lane, Grove Park, London, SE12 9PH | Semi-detached | 3 | - | £470,000 | Apr 2023 | |
| 63 Marvels Lane, Grove Park, London, SE12 9PH | Retail | 5 | 2 | £510,000 | May 2022 | |
| 75 Marvels Lane, Grove Park, London, SE12 9PH | Semi-detached | 3 | - | £285,000 | Nov 2013 | |
| 61 Marvels Lane, Grove Park, London, SE12 9PH | Terraced | 3 | 1 | £250,000 | Jul 2013 | |
| 77 Marvels Lane, Grove Park, London, SE12 9PH | Semi-detached | - | - | £279,950 | Apr 2013 | |
| 55 Marvels Lane, Grove Park, London, SE12 9PH | Terraced | 4 | 2 | £245,000 | Jan 2012 | |
| 53 Marvels Lane, Grove Park, London, SE12 9PH | house | 3 | - | £237,000 | Jun 2011 | |
| 99 Marvels Lane, Grove Park, London, SE12 9PH | house | 3 | - | £331,000 | Sep 2010 | |
| 85 Marvels Lane, Grove Park, London, SE12 9PH | Semi-detached | - | - | £270,000 | May 2008 |
Energy Efficiency in SE12 9PH
Daily life in SE12 9PH is supported by a dense ring of amenities within practical reach. Residents enjoy access to five retail outlets including Tesco Grove, Sainsburys Lewisham Grove, and Lidl LON for essential shopping. Transport connectivity is equally strong with five nearby rail stations such as Grove Park Station and Mottingham Station facilitating easy commutes. You can also utilise five metro locations like Elverson Road and Beckenham Road Tram Stop for cross-London travel. Cultural and water-based leisure options include five ferry terminals such as Greenwich Pier and Masthouse Terrace Pier. Additionally, London City Airport sits within reach, offering one-airport convenience for business travellers. This concentration of services means you need not travel far for groceries, work commutes, or weekend excursions. The presence of Sainsburys Lewisham Grove and Tesco Grove ensures that daily essentials are never far away. Ferry access points like Greenwich Pier provide alternative routes into the city that bypass road traffic. For families, the proximity to Lee and Mottingham stations expands the range of available schools and activities. Living in SE12 9PH grants you immediate access to a wide spectrum of commerce and transport without needing a car.
Amenities
Schools
| Rank | School | Type | Entry gender | Ages |
|---|
Explore more schools in this area
Go to Schools tabDemographics
The community inside SE12 9PH displays a clear demographic profile dominated by adults aged between 30 and 64 years. The median age for residents stands at 47, indicating a neighbourhood with fewer young families compared to other parts of London. House ownership stands at 52%, meaning that roughly half of the households live in their own properties while the remainder likely rent. This balance suggests a stable but not exclusively owner-occupied market. The predominant ethnic group in this specific postcode area is White, reflecting the broader historical patterns of the Lewisham and Bromley districts. Accommodation types are primarily Houses, distinguishing this area from zones dominated by high-rise flats or converted industrial units. A significant portion of the population falls within the 30-64 year bracket, which often correlates with established professionals or empty nesters. The demographic data reveals a mature community where the average resident has likely lived in London for an extended period. This age distribution influences local spending habits and community engagement, as older adults often prioritise stability and established neighbours. If you are looking for a quarter where the demographic median age is 47, SE12 9PH fits that specific description without deviation.
Household Size
Accommodation Type
Tenure
Ethnic Group
Religion
Household Composition
Age
Household Deprivation
NS-SEC
Explore more demographic insights in this area
Go to Demographics tabPlanning
Planning Constraints
- Flood RiskPremium
- Ramsar Wetland SitesPremium
- Area of Outstanding Natural BeautyPremium
- Protected Nature ReservePremium
- Protected WoodlandPremium