Area Overview for SA73 1RP
Photos of SA73 1RP
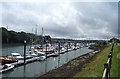
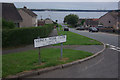
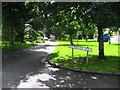
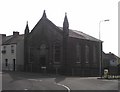
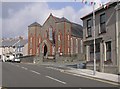
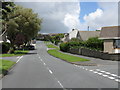
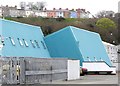
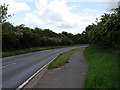
53 photos from this area
Area Information
Key information about the SA73 1RP including its size, population, and administrative classification.
- Area Type
- Postcode
- Area Size
- 8786 m²
- Population
- 1991
- Population Density
- 181 people/km²
House Prices in SA73 1RP
34
Properties
£109,657
Average Sold Price
£24,000
Lowest Price
£187,000
Highest Price
Showing 34 properties
| Address | Type | Beds | Baths | Last Sale Price | Last Sale Date | |
|---|---|---|---|---|---|---|
| 43 James Street, Neyland, SA73 1RP | Semi-detached | 3 | 1 | £157,000 | May 2025 | |
| 40 James Street, Neyland, SA73 1RP | Terraced | 3 | 1 | £180,000 | Sep 2022 | |
| 49 James Street, Neyland, SA73 1RP | Semi-detached | 3 | 1 | £168,000 | May 2022 | |
| 12 James Street, Neyland, SA73 1RP | Retail | 3 | 2 | £187,000 | Mar 2022 | |
| 27 James Street, Neyland, SA73 1RP | house | - | - | £110,000 | Aug 2021 | |
| 47 James Street, Neyland, SA73 1RP | Semi-detached | 3 | 1 | £115,000 | Jul 2021 | |
| 44 James Street, Neyland, SA73 1RP | Semi-detached | 2 | 1 | £100,000 | Jun 2021 | |
| 35 James Street, Neyland, SA73 1RP | Terraced | 3 | 1 | £112,500 | Dec 2016 | |
| 29 James Street, Neyland, SA73 1RP | Terraced | 2 | 1 | £83,000 | Jun 2016 | |
| 18 James Street, Neyland, SA73 1RP | house | 2 | - | £108,000 | Jul 2014 |
Page 1 of 4
Energy Efficiency in SA73 1RP
Amenities
Schools
| Rank | School | Type | Entry gender | Ages |
|---|
Explore more schools in this area
Go to Schools tabDemographics
Household Size
Two person
most common
Accommodation Type
Houses
most common
Tenure
68
majority
Ethnic Group
White
most common
Religion
N/A
most common
Household Composition
N/A
most common
Age
47
median
Adults (30-64 years)
most common
Household Deprivation
N/A
with no deprivation
NS-SEC
27
in Lower managerial occupations
Explore more demographic insights in this area
Go to Demographics tabPlanning
Planning Constraints
- Flood RiskPremium
- Ramsar Wetland SitesPremium
- Area of Outstanding Natural BeautyPremium
- Protected Nature ReservePremium
- Protected WoodlandPremium
- Crime RiskPremium