Area Overview for Neyland Community
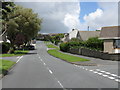
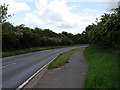
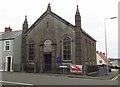
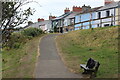
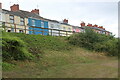
Photos of Neyland Community


Area Information
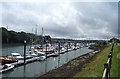
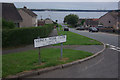
Neyland Community stands as a compact civil parish in Pembrokeshire, Wales, covering an area of just 2.1 km². This small town sits on the northern shore of the Milford Haven Waterway at the eastern end of Milford Haven, near the mouth of the River Cleddau. Although the town was historically insignificant with fewer than 200 inhabitants in 1851, it transformed rapidly after the South Wales Railway arrived in April 1856. Isambard Kingdom Brunel, who chose this location for the railway terminus, is regarded as the founder of modern Neyland. The town now hosts a vibrant community of around 3,000 residents who live within a landscape bounded by hedgerow agricultural fields to the north and west. Daily life in Neyland blends its maritime heritage with contemporary leisure and residential uses. You will find a beautiful Marina at Westfield Pill and a Yacht Club, which firmly place the town on the yachting map following regeneration that began in 1985. The area retains an industrial character from its history as a shipping and rail terminus, yet it has shifted focus towards tourism and transport links. A section of the Pembrokeshire Coast Path runs along the banks of Westfield Pill, offering residents access to coastal walking. The town also features the Brunel Trail, an off-road cycle link that connects Neyland with Haverfordwest, facilitating active travel for those who choose to bypass the roads. Living in Neyland means residing in a community that honours its engineering past while embracing a modern lifestyle centred on the water.
- Area Type
- Parish
- Area Size
- 2.1 km²
- Population
- Not available
- Population Density
- Not available
Demographics
The population profile of Neyland Community reflects a settled and stable community, with a median age of 70 years. This figure indicates that the residents are predominantly older adults, suggesting a retirement-focused demographic rather than a influx of young families or workers. While specific data on the most common age range is not detailed beyond the total category, the high median age shapes the character of the neighbourhood significantly. Housing ownership in Neyland is robust, with 68% of homes held by their occupants. This high rate of ownership suggests that the majority of residents have purchased their properties rather than renting, creating a stable tenant-free environment for owners. Household composition and predominant ethnic group statistics are recorded as totals in the available data, meaning specific details on family structures or diversity percentages are not explicitly broken out. Religion data is similarly listed as total without a specific denomination breakdown. Despite the lack of granular demographic layers, the high home-ownership rate of 68% points to a quarter-century ownership culture common in rural Welsh parishes. The community consists of around 3,000 residents who live in a compact space, which likely fosters close neighbourly relations among this older population. Living in Neyland means joining an area where long-term residents own their homes, and the community atmosphere is described as friendly and small. This demographic structure implies a quiet, low-energy daily life suited for those seeking retirement or retirement-style living.
Household Size
Accommodation Type
Tenure
Ethnic Group
Religion
Household Composition
Age
Household Deprivation
NS-SEC
Explore more demographic insights in this area
Go to Demographics tabPlanning
Planning Constraints
- Flood RiskPremium
- Ramsar Wetland SitesPremium
- Area of Outstanding Natural BeautyPremium
- Protected Nature ReservePremium
- Protected WoodlandPremium
- Crime RiskPremium