Area Overview for NP25 3EA
Photos of NP25 3EA
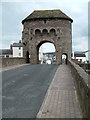
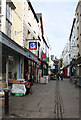
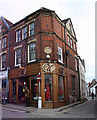
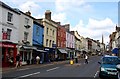
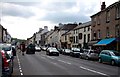
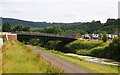
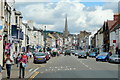
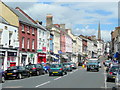


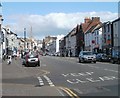
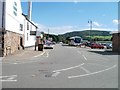
100 photos from this area
Area Information
Key information about the NP25 3EA including its size, population, and administrative classification.
- Area Type
- Postcode
- Area Size
- 3582 m²
- Population
- 1523
- Population Density
- 336 people/km²
House Prices in NP25 3EA
18
Properties
£290,625
Average Sold Price
£192,500
Lowest Price
£400,000
Highest Price
Showing 18 properties
| Address | Type | Beds | Baths | Last Sale Price | Last Sale Date | |
|---|---|---|---|---|---|---|
| Prospect House, St Johns Street, Monmouth, NP25 3EA | Semi-detached | - | - | £400,000 | Jul 2024 | |
| 4 St Johns Street, Monmouth, NP25 3EA | Terraced | 3 | 2 | £280,000 | Sep 2021 | |
| 7 St Johns Street, Monmouth, NP25 3EA | Terraced | 3 | 2 | £290,000 | Oct 2019 | |
| 6 St Johns Street, Monmouth, NP25 3EA | Terraced | - | - | £192,500 | Jun 2006 | |
| 5A St Johns Street, Monmouth, NP25 3EA | Semi-detached | 3 | 2 | - | - | |
| 2 St Johns Street, Monmouth, NP25 3EA | Terraced | 3 | 2 | - | - | |
| Storage At, The Coach House Restaurant, St Johns Street, Monmouth, NP25 3EA | Terraced | 4 | 4 | - | - | |
| 13A St Johns Street, Monmouth, NP25 3EA | undefined | - | - | - | - | |
| 8B St Johns Street, Monmouth, NP25 3EA | Terraced | - | - | - | - | |
| Ground Floor Flat, The Coach House Restaurant, St Johns Street, Monmouth, NP25 3EA | Flat | - | - | - | - |
Page 1 of 2
Energy Efficiency in NP25 3EA
Amenities
Schools
| Rank | School | Type | Entry gender | Ages |
|---|
Explore more schools in this area
Go to Schools tabDemographics
Household Size
One person
most common
Accommodation Type
Houses
most common
Tenure
61
majority
Ethnic Group
White
most common
Religion
N/A
most common
Household Composition
N/A
most common
Age
47
median
Adults (30-64 years)
most common
Household Deprivation
N/A
with no deprivation
NS-SEC
45
in Lower managerial occupations
Explore more demographic insights in this area
Go to Demographics tabPlanning
Planning Constraints
- Flood RiskPremium
- Ramsar Wetland SitesPremium
- Area of Outstanding Natural BeautyPremium
- Protected Nature ReservePremium
- Protected WoodlandPremium
- Crime RiskPremium