Area Overview for ST10 1ED
Photos of ST10 1ED
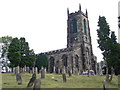
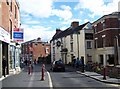

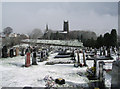
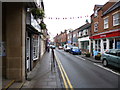
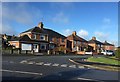
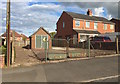
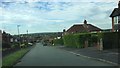
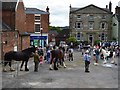
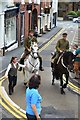
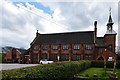
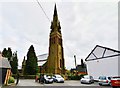
70 photos from this area
Area Information
Key information about the ST10 1ED including its size, population, and administrative classification.
- Area Type
- Postcode
- Area Size
- 9831 m²
- Population
- 1929
- Population Density
- 3016 people/km²
House Prices in ST10 1ED
19
Properties
£98,542
Average Sold Price
£28,000
Lowest Price
£245,000
Highest Price
Showing 19 properties
| Address | Type | Beds | Baths | Last Sale Price | Last Sale Date | |
|---|---|---|---|---|---|---|
| 32 Charles Street, Cheadle, ST10 1ED | house | 2 | 1 | £137,500 | Jul 2024 | |
| 12 Charles Street, Cheadle, ST10 1ED | house | - | - | £136,000 | Jan 2023 | |
| 36 Charles Street, Cheadle, ST10 1ED | house | 2 | - | £118,500 | Jun 2022 | |
| La Casita, 8 Charles Street, Cheadle, ST10 1ED | Detached | 3 | - | £245,000 | Mar 2022 | |
| 40 Charles Street, Cheadle, ST10 1ED | Cottage | 2 | 1 | £93,000 | Mar 2020 | |
| 30 Charles Street, Cheadle, ST10 1ED | Terraced | 2 | 1 | £74,000 | Sep 2017 | |
| 34 Charles Street, Cheadle, ST10 1ED | Semi-detached | 2 | 1 | £69,500 | Jan 2014 | |
| 42 Charles Street, Cheadle, ST10 1ED | house | 2 | - | £72,000 | Apr 2011 | |
| 6 Charles Street, Cheadle, ST10 1ED | Terraced | - | - | £115,000 | Oct 2007 | |
| 22 Charles Street, Cheadle, ST10 1ED | Detached | 2 | 1 | £60,000 | Jul 2003 |
Page 1 of 2
Energy Efficiency in ST10 1ED
Amenities
Schools
| Rank | School | Type | Entry gender | Ages |
|---|
Explore more schools in this area
Go to Schools tabDemographics
Household Size
One person
most common
Accommodation Type
Houses
most common
Tenure
53
majority
Ethnic Group
White
most common
Religion
N/A
most common
Household Composition
N/A
most common
Age
47
median
Adults (30-64 years)
most common
Household Deprivation
N/A
with no deprivation
NS-SEC
22
in Lower managerial occupations
Explore more demographic insights in this area
Go to Demographics tabPlanning
Planning Constraints
- Flood RiskPremium
- Ramsar Wetland SitesPremium
- Area of Outstanding Natural BeautyPremium
- Protected Nature ReservePremium
- Protected WoodlandPremium