Area Overview for B91 2QU
Photos of B91 2QU
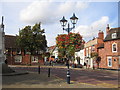
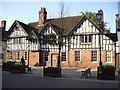
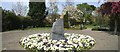
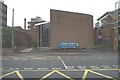
100 photos from this area
Area Information
Key information about the B91 2QU including its size, population, and administrative classification.
- Area Type
- Postcode
- Area Size
- 1.1 hectares
- Population
- 1740
- Population Density
- 2235 people/km²
House Prices in B91 2QU
32
Properties
£254,541
Average Sold Price
£165,000
Lowest Price
£350,000
Highest Price
Showing 32 properties
| Address | Type | Beds | Baths | Last Sale Price | Last Sale Date | |
|---|---|---|---|---|---|---|
| 32 Bushell Drive, Solihull, B91 2QU | Bungalow | 2 | 2 | £339,950 | May 2022 | |
| 30 Bushell Drive, Solihull, B91 2QU | Bungalow | 2 | - | £350,000 | Feb 2022 | |
| 31 Bushell Drive, Solihull, B91 2QU | Bungalow | 2 | 1 | £315,000 | Apr 2021 | |
| 25 Bushell Drive, Solihull, B91 2QU | house | - | - | £240,000 | Mar 2017 | |
| 22 Bushell Drive, Solihull, B91 2QU | Cottage | 2 | 2 | £280,000 | Jun 2016 | |
| 28 Bushell Drive, Solihull, B91 2QU | Detached | 2 | 2 | £275,000 | Apr 2015 | |
| 29 Bushell Drive, Solihull, B91 2QU | Terraced | 2 | 2 | £175,000 | Jul 2009 | |
| 23 Bushell Drive, Solihull, B91 2QU | house | - | - | £215,000 | Jan 2007 | |
| 24 Bushell Drive, Solihull, B91 2QU | Retirement | - | - | £230,000 | Nov 2004 | |
| 27 Bushell Drive, Solihull, B91 2QU | Retirement | - | - | £215,000 | Jun 2002 |
Page 1 of 4
Energy Efficiency in B91 2QU
Amenities
Schools
| Rank | School | Type | Entry gender | Ages |
|---|
Explore more schools in this area
Go to Schools tabDemographics
Household Size
One person
most common
Accommodation Type
Flats
most common
Tenure
65
majority
Ethnic Group
White
most common
Religion
N/A
most common
Household Composition
N/A
most common
Age
47
median
Elderly (65+ years)
most common
Household Deprivation
N/A
with no deprivation
NS-SEC
47
in Lower managerial occupations
Explore more demographic insights in this area
Go to Demographics tabPlanning
Planning Constraints
- Flood RiskPremium
- Ramsar Wetland SitesPremium
- Area of Outstanding Natural BeautyPremium
- Protected Nature ReservePremium
- Protected WoodlandPremium