Area Overview for B90 4RU
Photos of B90 4RU
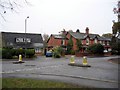
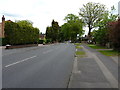
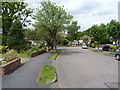
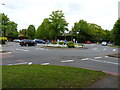

19 photos from this area
Area Information
Key information about the B90 4RU including its size, population, and administrative classification.
- Area Type
- Postcode
- Area Size
- 3.0 hectares
- Population
- 1730
- Population Density
- 2756 people/km²
House Prices in B90 4RU
52
Properties
£192,982
Average Sold Price
£48,000
Lowest Price
£350,000
Highest Price
Showing 52 properties
| Address | Type | Beds | Baths | Last Sale Price | Last Sale Date | |
|---|---|---|---|---|---|---|
| 106 Cranmore Boulevard, Shirley, Solihull, B90 4RU | Terraced | 3 | 1 | £340,000 | Nov 2025 | |
| 110 Cranmore Boulevard, Shirley, Solihull, B90 4RU | house | - | - | £257,000 | Aug 2024 | |
| 92 Cranmore Boulevard, Shirley, Solihull, B90 4RU | Terraced | 3 | 2 | £350,000 | Apr 2024 | |
| 50 Cranmore Boulevard, Shirley, Solihull, B90 4RU | Terraced | 3 | 1 | £250,000 | Oct 2023 | |
| 88 Cranmore Boulevard, Shirley, Solihull, B90 4RU | house | - | - | £345,500 | Feb 2023 | |
| 126 Cranmore Boulevard, Shirley, Solihull, B90 4RU | house | 3 | 2 | £244,000 | Jan 2023 | |
| 130 Cranmore Boulevard, Shirley, Solihull, B90 4RU | house | - | - | £245,000 | Dec 2021 | |
| 102 Cranmore Boulevard, Shirley, Solihull, B90 4RU | Terraced | 3 | 2 | £295,000 | Sep 2021 | |
| 58 Cranmore Boulevard, Shirley, Solihull, B90 4RU | house | - | - | £222,000 | Apr 2021 | |
| 78 Cranmore Boulevard, Shirley, Solihull, B90 4RU | house | - | - | £277,950 | Feb 2021 |
Page 1 of 6
Energy Efficiency in B90 4RU
Amenities
Schools
| Rank | School | Type | Entry gender | Ages |
|---|
Explore more schools in this area
Go to Schools tabDemographics
Household Size
Family (3-5 people)
most common
Accommodation Type
Houses
most common
Tenure
77
majority
Ethnic Group
White
most common
Religion
N/A
most common
Household Composition
N/A
most common
Age
47
median
Adults (30-64 years)
most common
Household Deprivation
N/A
with no deprivation
NS-SEC
38
in Lower managerial occupations
Explore more demographic insights in this area
Go to Demographics tabPlanning
Planning Constraints
- Flood RiskPremium
- Ramsar Wetland SitesPremium
- Area of Outstanding Natural BeautyPremium
- Protected Nature ReservePremium
- Protected WoodlandPremium