Area Overview for B90 2EG
Photos of B90 2EG
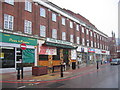
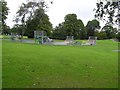
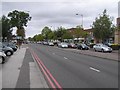
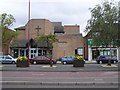

50 photos from this area
Area Information
Key information about the B90 2EG including its size, population, and administrative classification.
- Area Type
- Postcode
- Area Size
- 4.8 hectares
- Population
- 1247
- Population Density
- 25759 people/km²
House Prices in B90 2EG
33
Properties
£221,689
Average Sold Price
£72,500
Lowest Price
£375,000
Highest Price
Showing 33 properties
| Address | Type | Beds | Baths | Last Sale Price | Last Sale Date | |
|---|---|---|---|---|---|---|
| 25 Haslucks Croft, Shirley, Solihull, B90 2EG | house | 4 | 2 | £375,000 | Nov 2023 | |
| 2 Haslucks Croft, Shirley, Solihull, B90 2EG | Semi-detached | 3 | 1 | £360,000 | Jun 2021 | |
| 21 Haslucks Croft, Shirley, Solihull, B90 2EG | house | - | - | £330,000 | May 2021 | |
| 34 Haslucks Croft, Shirley, Solihull, B90 2EG | Semi-detached | 3 | 1 | £325,000 | Jan 2019 | |
| 4 Haslucks Croft, Shirley, Solihull, B90 2EG | Semi-detached | 3 | 1 | £325,000 | Aug 2018 | |
| 24 Haslucks Croft, Shirley, Solihull, B90 2EG | Detached | 3 | - | £332,000 | Sep 2017 | |
| 15 Haslucks Croft, Shirley, Solihull, B90 2EG | Semi-detached | 3 | - | £275,000 | Dec 2014 | |
| 16 Haslucks Croft, Shirley, Solihull, B90 2EG | house | - | - | £250,000 | May 2014 | |
| 7 Haslucks Croft, Shirley, Solihull, B90 2EG | house | - | - | £232,000 | Dec 2013 | |
| 32 Haslucks Croft, Shirley, Solihull, B90 2EG | house | - | - | £212,000 | Dec 2012 |
Page 1 of 4
Energy Efficiency in B90 2EG
Amenities
Schools
| Rank | School | Type | Entry gender | Ages |
|---|
Explore more schools in this area
Go to Schools tabDemographics
Household Size
Family (3-5 people)
most common
Accommodation Type
Houses
most common
Tenure
73
majority
Ethnic Group
White
most common
Religion
N/A
most common
Household Composition
N/A
most common
Age
47
median
Adults (30-64 years)
most common
Household Deprivation
N/A
with no deprivation
NS-SEC
34
in Lower managerial occupations
Explore more demographic insights in this area
Go to Demographics tabPlanning
Planning Constraints
- Flood RiskPremium
- Ramsar Wetland SitesPremium
- Area of Outstanding Natural BeautyPremium
- Protected Nature ReservePremium
- Protected WoodlandPremium