Area Overview for B13 8EY
Photos of B13 8EY
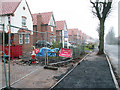
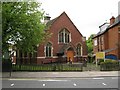
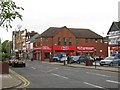
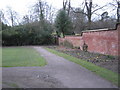

80 photos from this area
Area Information
Key information about the B13 8EY including its size, population, and administrative classification.
- Area Type
- Postcode
- Area Size
- 1.5 hectares
- Population
- 1535
- Population Density
- 3475 people/km²
House Prices in B13 8EY
42
Properties
£213,942
Average Sold Price
£35,000
Lowest Price
£363,000
Highest Price
Showing 42 properties
| Address | Type | Beds | Baths | Last Sale Price | Last Sale Date | |
|---|---|---|---|---|---|---|
| 232 Alcester Road, Birmingham, B13 8EY | Terraced | 2 | 1 | £315,000 | Jul 2024 | |
| 190 Alcester Road, Birmingham, B13 8EY | Terraced | 3 | 1 | £315,000 | Apr 2023 | |
| 230 Alcester Road, Birmingham, B13 8EY | Terraced | 2 | 1 | £320,000 | Dec 2022 | |
| 212 Alcester Road, Birmingham, B13 8EY | Terraced | 2 | 1 | £363,000 | Jun 2022 | |
| 198 Alcester Road, Birmingham, B13 8EY | Terraced | 2 | 1 | £260,000 | Jun 2022 | |
| 244 Alcester Road, Birmingham, B13 8EY | Maisonette | 2 | 1 | £150,000 | Jun 2021 | |
| 196 Alcester Road, Birmingham, B13 8EY | Terraced | 3 | 2 | £260,000 | Aug 2020 | |
| 248 Alcester Road, Birmingham, B13 8EY | Maisonette | 2 | 1 | £171,000 | Jun 2020 | |
| 226 Alcester Road, Birmingham, B13 8EY | Terraced | 2 | 1 | £299,950 | May 2020 | |
| 192 Alcester Road, Birmingham, B13 8EY | Terraced | 2 | 1 | £272,000 | Apr 2017 |
Page 1 of 5
Energy Efficiency in B13 8EY
Amenities
Schools
| Rank | School | Type | Entry gender | Ages |
|---|
Explore more schools in this area
Go to Schools tabDemographics
Household Size
One person
most common
Accommodation Type
Houses
most common
Tenure
47
majority
Ethnic Group
White
most common
Religion
N/A
most common
Household Composition
N/A
most common
Age
47
median
Adults (30-64 years)
most common
Household Deprivation
N/A
with no deprivation
NS-SEC
50
in Lower managerial occupations
Explore more demographic insights in this area
Go to Demographics tabPlanning
Planning Constraints
- Flood RiskPremium
- Ramsar Wetland SitesPremium
- Area of Outstanding Natural BeautyPremium
- Protected Nature ReservePremium
- Protected WoodlandPremium