Area Overview for B13 0JA
Photos of B13 0JA
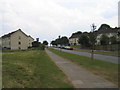
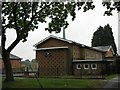
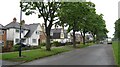
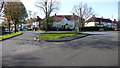
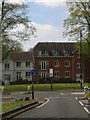
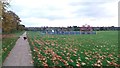
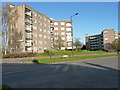
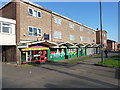
21 photos from this area
Area Information
Key information about the B13 0JA including its size, population, and administrative classification.
- Area Type
- Postcode
- Area Size
- 6333 m²
- Population
- 1771
- Population Density
- 3164 people/km²
House Prices in B13 0JA
29
Properties
£121,895
Average Sold Price
£20,000
Lowest Price
£220,000
Highest Price
Showing 29 properties
| Address | Type | Beds | Baths | Last Sale Price | Last Sale Date | |
|---|---|---|---|---|---|---|
| 38 Bondfield Road, Birmingham, B13 0JA | Terraced | 3 | 1 | £220,000 | Jul 2023 | |
| 14 Bondfield Road, Birmingham, B13 0JA | Terraced | 3 | 1 | £125,000 | Mar 2017 | |
| 15 Bondfield Road, Birmingham, B13 0JA | house | - | - | £95,000 | Apr 2013 | |
| 26 Bondfield Road, Birmingham, B13 0JA | house | 3 | - | £129,000 | Jan 2011 | |
| 19 Bondfield Road, Birmingham, B13 0JA | Terraced | - | - | £135,000 | Apr 2008 | |
| 13 Bondfield Road, Birmingham, B13 0JA | Terraced | 3 | 1 | £131,000 | Mar 2008 | |
| 17 Bondfield Road, Birmingham, B13 0JA | Terraced | - | - | £139,950 | Aug 2007 | |
| 25 Bondfield Road, Birmingham, B13 0JA | house | 3 | 1 | £20,000 | Dec 2006 | |
| 36 Bondfield Road, Birmingham, B13 0JA | Semi-detached | 6 | - | £124,000 | May 2006 | |
| 27 Bondfield Road, Birmingham, B13 0JA | Terraced | - | - | £100,000 | Feb 2004 |
Page 1 of 3
Energy Efficiency in B13 0JA
Amenities
Schools
| Rank | School | Type | Entry gender | Ages |
|---|
Explore more schools in this area
Go to Schools tabDemographics
Household Size
Family (3-5 people)
most common
Accommodation Type
Houses
most common
Tenure
41
majority
Ethnic Group
White
most common
Religion
N/A
most common
Household Composition
N/A
most common
Age
47
median
Adults (30-64 years)
most common
Household Deprivation
N/A
with no deprivation
NS-SEC
19
in Lower managerial occupations
Explore more demographic insights in this area
Go to Demographics tabPlanning
Planning Constraints
- Flood RiskPremium
- Ramsar Wetland SitesPremium
- Area of Outstanding Natural BeautyPremium
- Protected Nature ReservePremium
- Protected WoodlandPremium