Area Overview for TQ5 0LU
Photos of TQ5 0LU
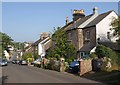
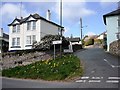
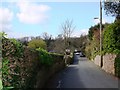
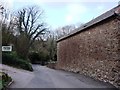
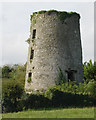
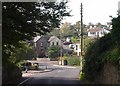
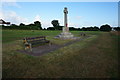
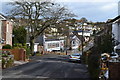
96 photos from this area
Area Information
Key information about the TQ5 0LU including its size, population, and administrative classification.
- Area Type
- Postcode
- Area Size
- 1.3 hectares
- Population
- 1243
- Population Density
- 260 people/km²
House Prices in TQ5 0LU
18
Properties
£299,597
Average Sold Price
£177,000
Lowest Price
£435,000
Highest Price
Showing 18 properties
| Address | Type | Beds | Baths | Last Sale Price | Last Sale Date | |
|---|---|---|---|---|---|---|
| 7 Galmpton Glade, Brixham, TQ5 0LU | Retail | 2 | 1 | £435,000 | Mar 2022 | |
| 5 Galmpton Glade, Brixham, TQ5 0LU | Bungalow | - | - | £390,000 | Jan 2022 | |
| 2 Galmpton Glade, Brixham, TQ5 0LU | Detached | - | - | £390,000 | Jun 2021 | |
| 14 Galmpton Glade, Brixham, TQ5 0LU | Bungalow | 3 | 1 | £335,000 | Mar 2019 | |
| 8 Galmpton Glade, Brixham, TQ5 0LU | Bungalow | 2 | 1 | £292,000 | Nov 2018 | |
| 4 Galmpton Glade, Brixham, TQ5 0LU | Bungalow | - | - | £295,000 | Jun 2018 | |
| 22 Galmpton Glade, Brixham, TQ5 0LU | Bungalow | 3 | 1 | £388,000 | Jun 2018 | |
| 3 Galmpton Glade, Brixham, TQ5 0LU | Bungalow | 2 | 1 | £230,000 | Jun 2015 | |
| 16 Galmpton Glade, Brixham, TQ5 0LU | Bungalow | 3 | - | £290,000 | Feb 2014 | |
| 24 Galmpton Glade, Brixham, TQ5 0LU | Bungalow | 3 | - | £360,000 | Mar 2013 |
Page 1 of 2
Energy Efficiency in TQ5 0LU
Amenities
Schools
| Rank | School | Type | Entry gender | Ages |
|---|
Explore more schools in this area
Go to Schools tabDemographics
Household Size
Two person
most common
Accommodation Type
Houses
most common
Tenure
78
majority
Ethnic Group
White
most common
Religion
N/A
most common
Household Composition
N/A
most common
Age
47
median
Elderly (65+ years)
most common
Household Deprivation
N/A
with no deprivation
NS-SEC
36
in Lower managerial occupations
Explore more demographic insights in this area
Go to Demographics tabPlanning
Planning Constraints
- Flood RiskPremium
- Ramsar Wetland SitesPremium
- Area of Outstanding Natural BeautyPremium
- Protected Nature ReservePremium
- Protected WoodlandPremium