Area Overview for TA9 3LW
Photos of TA9 3LW
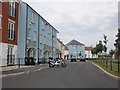
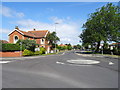
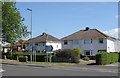
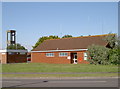
15 photos from this area
Area Information
Key information about the TA9 3LW including its size, population, and administrative classification.
- Area Type
- Postcode
- Area Size
- 2.8 hectares
- Population
- 2087
- Population Density
- 1563 people/km²
House Prices in TA9 3LW
43
Properties
£167,374
Average Sold Price
£48,000
Lowest Price
£251,000
Highest Price
Showing 43 properties
| Address | Type | Beds | Baths | Last Sale Price | Last Sale Date | |
|---|---|---|---|---|---|---|
| 35 Oldway Place, Highbridge, TA9 3LW | house | 3 | 1 | £248,000 | Oct 2025 | |
| 46 Oldway Place, Highbridge, TA9 3LW | Semi-detached | 2 | 1 | £245,000 | Dec 2024 | |
| 44 Oldway Place, Highbridge, TA9 3LW | Bungalow | - | - | £251,000 | Nov 2021 | |
| 8 Oldway Place, Highbridge, TA9 3LW | Semi-detached | 2 | - | £225,000 | Mar 2021 | |
| 2 Oldway Place, Highbridge, TA9 3LW | Retail | 3 | 1 | £208,000 | Feb 2020 | |
| 42 Oldway Place, Highbridge, TA9 3LW | Semi-detached | 2 | 1 | £215,000 | Nov 2019 | |
| 29 Oldway Place, Highbridge, TA9 3LW | Bungalow | - | - | £220,000 | Jul 2019 | |
| 50 Oldway Place, Highbridge, TA9 3LW | Bungalow | 2 | - | £212,500 | Nov 2017 | |
| 37 Oldway Place, Highbridge, TA9 3LW | Detached | 3 | 1 | £172,500 | Jul 2016 | |
| 4 Oldway Place, Highbridge, TA9 3LW | Bungalow | 2 | - | £156,000 | Jul 2013 |
Page 1 of 5
Energy Efficiency in TA9 3LW
Amenities
Schools
| Rank | School | Type | Entry gender | Ages |
|---|
Explore more schools in this area
Go to Schools tabDemographics
Household Size
Two person
most common
Accommodation Type
Houses
most common
Tenure
65
majority
Ethnic Group
White
most common
Religion
N/A
most common
Household Composition
N/A
most common
Age
47
median
Adults (30-64 years)
most common
Household Deprivation
N/A
with no deprivation
NS-SEC
19
in Lower managerial occupations
Explore more demographic insights in this area
Go to Demographics tabPlanning
Planning Constraints
- Flood RiskPremium
- Ramsar Wetland SitesPremium
- Area of Outstanding Natural BeautyPremium
- Protected Nature ReservePremium
- Protected WoodlandPremium