Area Overview for Quedgeley
Photos of Quedgeley
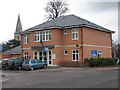
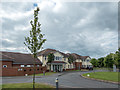
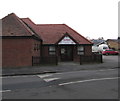
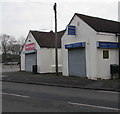
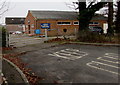
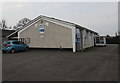
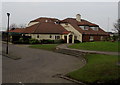
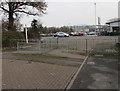
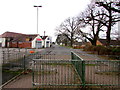
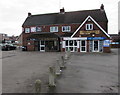
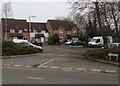
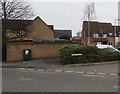
Area Information
Living in Quedgeley offers a distinct experience defined by its compact scale and established character. This county electoral division occupies just 5.8 square kilometres, yet it hosts a population of 6,639 residents. The result is a community with a population density of 1,141 people per square kilometre, creating an environment that feels manageable without being isolated. The area serves as a recognised residential zone within a larger local-government structure, functioning as a defined neighbourhood rather than a sprawling metropolitan district. Daily life here involves navigating a tight-knit settlement where residents share common local facilities and infrastructure. The geographic limits of the area mean that distances to key amenities are generally walkable or short distance drives. Your mornings might begin with neighbours already out, reflecting a community accustomed to the rhythms of suburban living. The envelope of Quedgeley is clear and bounded, providing a sense of enclosure that many buyers seek. Understanding the physical footprint of these 6,639 homes helps you grasp the scale of local services you will rely on. The area is a solid, defined choice for those who prefer a settled residential pattern over rapid urban expansion.
- Area Type
- Parish
- Area Size
- 5.8 km²
- Population
- 6639
- Population Density
- 1141 people/km²
Demographics
The community in Quedgeley is defined by a mature population structure. Analysis of the age profile reveals a median age of 70 years, indicating that the area is home to a significant senior demographic. While specific breakdowns for age bands appear general in available records, the central tendency points clearly to an older settlement. Home ownership stands as a defining feature, with 71% of households owned outright or through a mortgage arrangement. This high rate suggests a stable community where residents have long-term investment in their local surroundings. The remaining 29% of households likely represent landlords or younger buyers entering the market. Data on household composition types is recorded but not detailed further in current figures, meaning you cannot specify single-person homes versus families without guessing. Similarly, information on predominant ethnic groups and religious affiliations is noted as a total category without further subdivision. For a homebuyer, the 71% ownership figure is the most critical metric, signalling an established market rather than one dominated by transient tenants. The demographic reality here is older residents and secure tenure.
Household Size
Accommodation Type
Tenure
Ethnic Group
Religion
Household Composition
Age
Household Deprivation
NS-SEC
Explore more demographic insights in this area
Go to Demographics tabPlanning
Planning Constraints
- Flood RiskPremium
- Ramsar Wetland SitesPremium
- Area of Outstanding Natural BeautyPremium
- Protected Nature ReservePremium
- Protected WoodlandPremium