Area Overview for Chichester
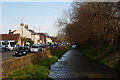
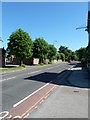
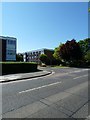
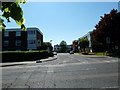
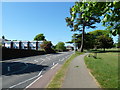
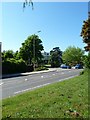
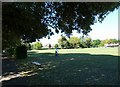
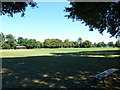
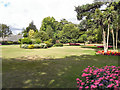
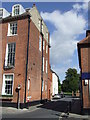
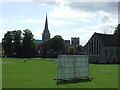
Photos of Chichester

Area Information
Chichester serves as a compact district borough unitary authority in England, covering a total area of 9.2 square kilometres. This relatively small footprint supports a current population of 8,541 people, creating a population density of 930 inhabitants per square kilometre. Living in Chichester means inhabiting a tightly knit district where space is at a premium. The area functions as a local authority district, providing governance and services for its residents within these defined boundaries. Daily life in Chichester is characterised by close proximity to neighbours due to the limited land mass. You will find that the community interactions are inevitable rather than accidental because the physical environment forces a higher degree of contact between households. The low total area size means that travel distances across the district are generally short. However, the high density also suggests that outdoor communal spaces may be constrained compared to larger rural towns. The district operates with the administrative structure of a unitary authority, streamlining many local government functions. For those moving to Chichester, the reality is one of living in a defined, manageable territory where population distribution is concentrated. The area size directly influences the pace of life, offering a setting where the distinction between different neighbourhoods is less pronounced than in sprawling metropolitan zones.
- Area Type
- Built Up Area 250
- Area Size
- 9.2 km²
- Population
- 8541
- Population Density
- 930 people/km²
Amenities
Schools
| Rank | School | Type | Entry gender | Ages |
|---|
Explore more schools in this area
Go to Schools tabDemographics
The community in Chichester displays a distinct demographic profile shaped by its age and ownership patterns. The median age of the population is precisely 70 years, indicating that the area consists largely of an older demographic group. Age data confirms that the total population skews significantly towards senior residents, a fact that will influence your daily surroundings and local services. Home ownership stands at 60%, meaning the majority of households own their property outright or with a mortgage rather than renting. This high rate of ownership suggests stability and long-term residency among many families. Accommodation type statistics are recorded as total figures, reflecting the diverse housing stock available within these 9.2 square kilometres. The household composition data covers the entire population, revealing how families and singles are distributed across the district. While specific details on predominant ethnicity and religious affiliation are recorded in total categories, the primary demographic driver is clearly age. A median age of 70 means you will encounter a population accustomed to retired lifestyles or those approaching it. This contrasts sharply with younger urban centres where career families dominate the scene. The 60% home ownership rate further implies that many residents look to stay for decades. There are no transient populations in the same volume as student-heavy zones because the age profile does not support large university cohorts.
Household Size
Accommodation Type
Tenure
Ethnic Group
Religion
Household Composition
Age
Household Deprivation
NS-SEC
Explore more demographic insights in this area
Go to Demographics tabPlanning
Planning Constraints
- Crime RiskPremium