Area Overview for SO19 8ES
Photos of SO19 8ES
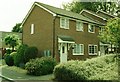
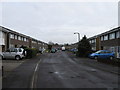
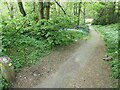
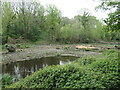
39 photos from this area
Area Information
Key information about the SO19 8ES including its size, population, and administrative classification.
- Area Type
- Postcode
- Area Size
- 1.8 hectares
- Population
- 1509
- Population Density
- 7241 people/km²
House Prices in SO19 8ES
22
Properties
£185,688
Average Sold Price
£35,000
Lowest Price
£291,000
Highest Price
Showing 22 properties
| Address | Type | Beds | Baths | Last Sale Price | Last Sale Date | |
|---|---|---|---|---|---|---|
| 67 St Monica Road, Southampton, SO19 8ES | house | - | - | £275,000 | Aug 2022 | |
| 59 St Monica Road, Southampton, SO19 8ES | house | 3 | 1 | £285,000 | Mar 2022 | |
| 55 St Monica Road, Southampton, SO19 8ES | house | - | - | £255,000 | Nov 2021 | |
| 65 St Monica Road, Southampton, SO19 8ES | Semi-detached | 3 | 1 | £280,000 | Sep 2020 | |
| 101 St Monica Road, Southampton, SO19 8ES | Bungalow | 3 | 2 | £291,000 | Jul 2020 | |
| 63 St Monica Road, Southampton, SO19 8ES | Bungalow | 2 | 1 | £225,000 | Nov 2018 | |
| 61 St Monica Road, Southampton, SO19 8ES | Semi-detached | 2 | - | £172,500 | Nov 2016 | |
| 69 St Monica Road, Southampton, SO19 8ES | Semi-detached | 3 | 1 | £177,500 | Feb 2014 | |
| 51A St Monica Road, Southampton, SO19 8ES | house | - | - | £180,000 | Oct 2013 | |
| 53 St Monica Road, Southampton, SO19 8ES | Detached | - | - | £158,000 | Dec 2006 |
Page 1 of 3
Energy Efficiency in SO19 8ES
Amenities
Schools
| Rank | School | Type | Entry gender | Ages |
|---|
Explore more schools in this area
Go to Schools tabDemographics
Household Size
Family (3-5 people)
most common
Accommodation Type
Houses
most common
Tenure
65
majority
Ethnic Group
White
most common
Religion
N/A
most common
Household Composition
N/A
most common
Age
47
median
Adults (30-64 years)
most common
Household Deprivation
N/A
with no deprivation
NS-SEC
27
in Lower managerial occupations
Explore more demographic insights in this area
Go to Demographics tabPlanning
Planning Constraints
- Flood RiskPremium
- Ramsar Wetland SitesPremium
- Area of Outstanding Natural BeautyPremium
- Protected Nature ReservePremium
- Protected WoodlandPremium