Area Overview for BN1 4EU
Photos of BN1 4EU

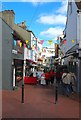
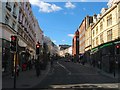
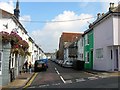
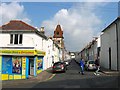
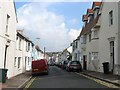
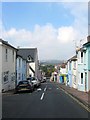
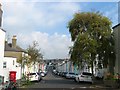
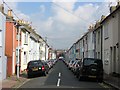
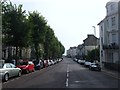
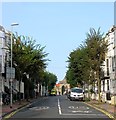
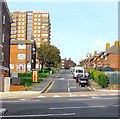
100 photos from this area
Area Information
Key information about the BN1 4EU including its size, population, and administrative classification.
- Area Type
- Postcode
- Area Size
- 2014 m²
- Population
- Not available
- Population Density
- Not available
House Prices in BN1 4EU
20
Properties
£297,234
Average Sold Price
£200,000
Lowest Price
£430,000
Highest Price
Showing 20 properties
| Address | Type | Beds | Baths | Last Sale Price | Last Sale Date | |
|---|---|---|---|---|---|---|
| 13 St Georges Mews, Brighton, BN1 4EU | Terraced | 2 | 1 | £410,000 | Nov 2023 | |
| 19 St Georges Mews, Brighton, BN1 4EU | Terraced | 2 | 1 | £390,000 | Jun 2023 | |
| 25 St Georges Mews, Brighton, BN1 4EU | Retail | 2 | 1 | £430,000 | May 2022 | |
| 17 St Georges Mews, Brighton, BN1 4EU | Terraced | 2 | 1 | £370,000 | Dec 2021 | |
| 10A St Georges Mews, Brighton, BN1 4EU | Maisonette | 2 | 1 | £200,000 | Jun 2019 | |
| 9 St Georges Mews, Brighton, BN1 4EU | house | 2 | - | £274,000 | Jan 2013 | |
| 23 St Georges Mews, Brighton, BN1 4EU | Terraced | 3 | 2 | £230,385 | May 2012 | |
| 12 St Georges Mews, Brighton, BN1 4EU | Terraced | 2 | 1 | £210,000 | Feb 2011 | |
| 15 St Georges Mews, Brighton, BN1 4EU | Detached | 2 | - | £249,950 | Nov 2010 | |
| 8 St Georges Mews, Brighton, BN1 4EU | house | 2 | - | £208,000 | Aug 2004 |
Page 1 of 2
Energy Efficiency in BN1 4EU
Amenities
Schools
| Rank | School | Type | Entry gender | Ages |
|---|
Explore more schools in this area
Go to Schools tabDemographics
Household Size
One person
most common
Accommodation Type
Flats
most common
Tenure
24
majority
Ethnic Group
White
most common
Religion
N/A
most common
Household Composition
N/A
most common
Age
22
median
Young Adults (15-29 years)
most common
Household Deprivation
N/A
with no deprivation
NS-SEC
30
in Lower managerial occupations
Explore more demographic insights in this area
Go to Demographics tabPlanning
Planning Constraints
- Flood RiskPremium
- Ramsar Wetland SitesPremium
- Area of Outstanding Natural BeautyPremium
- Protected Nature ReservePremium
- Protected WoodlandPremium