Area Overview for BN1 4ET
Photos of BN1 4ET
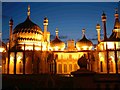
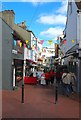
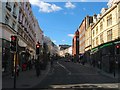
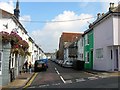
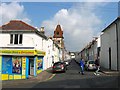
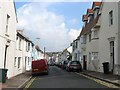
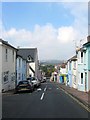
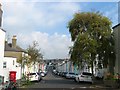
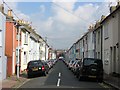
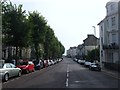
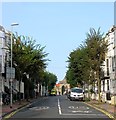
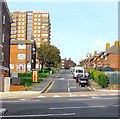
100 photos from this area
Area Information
Key information about the BN1 4ET including its size, population, and administrative classification.
- Area Type
- Postcode
- Area Size
- 3759 m²
- Population
- Not available
- Population Density
- Not available
House Prices in BN1 4ET
38
Properties
£510,500
Average Sold Price
£180,000
Lowest Price
£900,000
Highest Price
Showing 38 properties
| Address | Type | Beds | Baths | Last Sale Price | Last Sale Date | |
|---|---|---|---|---|---|---|
| 6 Pelham Square, Brighton, BN1 4ET | Terraced | 4 | 2 | £865,000 | Oct 2022 | |
| 4 Pelham Square, Brighton, BN1 4ET | Terraced | 5 | 1 | £856,500 | Aug 2021 | |
| 7 Pelham Square, Brighton, BN1 4ET | Terraced | 4 | - | £875,000 | Mar 2021 | |
| 1 Pelham Square, Brighton, BN1 4ET | Terraced | 2 | 1 | £900,000 | May 2020 | |
| 20 Pelham Square, Brighton, BN1 4ET | house | 3 | 2 | £790,000 | Jun 2019 | |
| 16 Pelham Square, Brighton, BN1 4ET | Detached | - | - | £640,000 | Apr 2019 | |
| 11 Pelham Square, Brighton, BN1 4ET | Terraced | 3 | 1 | £535,000 | Feb 2017 | |
| 2 Pelham Square, Brighton, BN1 4ET | Detached | - | - | £675,000 | Aug 2013 | |
| 15 Pelham Square, Brighton, BN1 4ET | house | - | - | £397,000 | Jun 2013 | |
| 3 Pelham Square, Brighton, BN1 4ET | Terraced | - | - | £436,000 | Apr 2007 |
Page 1 of 4
Energy Efficiency in BN1 4ET
Amenities
Schools
| Rank | School | Type | Entry gender | Ages |
|---|
Explore more schools in this area
Go to Schools tabDemographics
Household Size
One person
most common
Accommodation Type
Flats
most common
Tenure
24
majority
Ethnic Group
White
most common
Religion
N/A
most common
Household Composition
N/A
most common
Age
22
median
Young Adults (15-29 years)
most common
Household Deprivation
N/A
with no deprivation
NS-SEC
30
in Lower managerial occupations
Explore more demographic insights in this area
Go to Demographics tabPlanning
Planning Constraints
- Flood RiskPremium
- Ramsar Wetland SitesPremium
- Area of Outstanding Natural BeautyPremium
- Protected Nature ReservePremium
- Protected WoodlandPremium