Area Overview for SW17 7UH
Photos of SW17 7UH

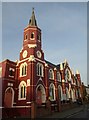
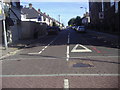
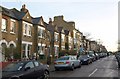
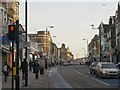
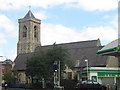
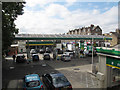
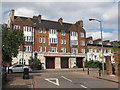
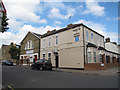

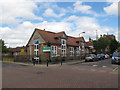
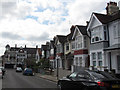
100 photos from this area
Area Information
Key information about the SW17 7UH including its size, population, and administrative classification.
- Area Type
- Postcode
- Area Size
- 1.1 hectares
- Population
- 1847
- Population Density
- 3193 people/km²
House Prices in SW17 7UH
51
Properties
£298,306
Average Sold Price
£43,500
Lowest Price
£627,250
Highest Price
Showing 51 properties
| Address | Type | Beds | Baths | Last Sale Price | Last Sale Date | |
|---|---|---|---|---|---|---|
| 34 St Peters Close, London, SW17 7UH | Flat | 2 | 2 | £591,500 | Nov 2025 | |
| 35 St Peters Close, London, SW17 7UH | Terraced | 2 | 1 | £535,000 | May 2025 | |
| 19 St Peters Close, London, SW17 7UH | Terraced | 1 | 1 | £627,250 | Mar 2025 | |
| 51 St Peters Close, London, SW17 7UH | Semi-detached | 1 | 1 | £540,000 | Nov 2024 | |
| 22 St Peters Close, London, SW17 7UH | Maisonette | - | - | £500,000 | Aug 2024 | |
| 44 St Peters Close, London, SW17 7UH | Flat | 1 | 1 | £295,000 | Aug 2023 | |
| 7 St Peters Close, London, SW17 7UH | Terraced | 2 | 1 | £450,000 | Jun 2023 | |
| 47 St Peters Close, London, SW17 7UH | Flat | 1 | 1 | £275,000 | May 2022 | |
| 9 St Peters Close, London, SW17 7UH | house | 1 | 1 | £490,000 | Jun 2021 | |
| 11 St Peters Close, London, SW17 7UH | Terraced | 2 | - | £580,000 | Jan 2021 |
Page 1 of 6
Energy Efficiency in SW17 7UH
Amenities
Schools
| Rank | School | Type | Entry gender | Ages |
|---|
Explore more schools in this area
Go to Schools tabDemographics
Household Size
Family (3-5 people)
most common
Accommodation Type
Houses
most common
Tenure
67
majority
Ethnic Group
White
most common
Religion
N/A
most common
Household Composition
N/A
most common
Age
47
median
Adults (30-64 years)
most common
Household Deprivation
N/A
with no deprivation
NS-SEC
66
in Lower managerial occupations
Explore more demographic insights in this area
Go to Demographics tabPlanning
Planning Constraints
- Flood RiskPremium
- Ramsar Wetland SitesPremium
- Area of Outstanding Natural BeautyPremium
- Protected Nature ReservePremium
- Protected WoodlandPremium