Area Overview for SE12 0RN
Photos of SE12 0RN
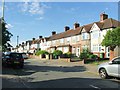
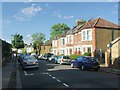
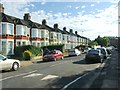
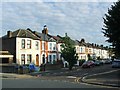
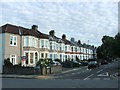
84 photos from this area
Area Information
Key information about the SE12 0RN including its size, population, and administrative classification.
- Area Type
- Postcode
- Area Size
- 1.0 hectares
- Population
- 1496
- Population Density
- 4313 people/km²
House Prices in SE12 0RN
35
Properties
£378,633
Average Sold Price
£76,000
Lowest Price
£815,000
Highest Price
Showing 35 properties
| Address | Type | Beds | Baths | Last Sale Price | Last Sale Date | |
|---|---|---|---|---|---|---|
| 20 Milborough Crescent, London, SE12 0RN | Terraced | 4 | 3 | £815,000 | Feb 2025 | |
| 44 Milborough Crescent, London, SE12 0RN | Terraced | 3 | 1 | £565,000 | Nov 2024 | |
| 60 Milborough Crescent, London, SE12 0RN | Terraced | 4 | 1 | £451,000 | Dec 2023 | |
| 8 Milborough Crescent, London, SE12 0RN | house | - | - | £635,000 | Feb 2023 | |
| 2 Milborough Crescent, London, SE12 0RN | Retail | 3 | 1 | £616,850 | Dec 2022 | |
| 32 Milborough Crescent, London, SE12 0RN | house | 4 | - | £650,000 | Oct 2022 | |
| 62 Milborough Crescent, London, SE12 0RN | house | 3 | - | £699,950 | Sep 2021 | |
| 52 Milborough Crescent, London, SE12 0RN | house | - | - | £673,750 | Feb 2021 | |
| 12 Milborough Crescent, London, SE12 0RN | Terraced | 3 | 1 | £510,000 | Dec 2017 | |
| 4 Milborough Crescent, London, SE12 0RN | Terraced | 3 | 1 | £485,000 | Aug 2017 |
Page 1 of 4
Energy Efficiency in SE12 0RN
Amenities
Schools
| Rank | School | Type | Entry gender | Ages |
|---|
Explore more schools in this area
Go to Schools tabDemographics
Household Size
Family (3-5 people)
most common
Accommodation Type
Houses
most common
Tenure
73
majority
Ethnic Group
White
most common
Religion
N/A
most common
Household Composition
N/A
most common
Age
47
median
Adults (30-64 years)
most common
Household Deprivation
N/A
with no deprivation
NS-SEC
52
in Lower managerial occupations
Explore more demographic insights in this area
Go to Demographics tabPlanning
Planning Constraints
- Flood RiskPremium
- Ramsar Wetland SitesPremium
- Area of Outstanding Natural BeautyPremium
- Protected Nature ReservePremium
- Protected WoodlandPremium