Area Overview for E13 8RL
Photos of E13 8RL
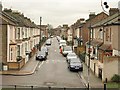
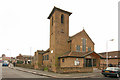

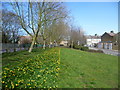
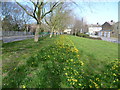
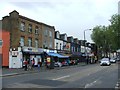
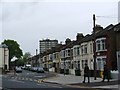
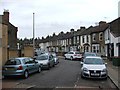
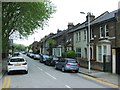
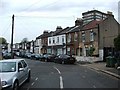
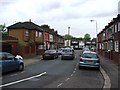
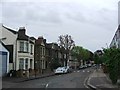
80 photos from this area
Area Information
Key information about the E13 8RL including its size, population, and administrative classification.
- Area Type
- Postcode
- Area Size
- 1.4 hectares
- Population
- 2201
- Population Density
- 6225 people/km²
House Prices in E13 8RL
56
Properties
£208,037
Average Sold Price
£29,995
Lowest Price
£450,000
Highest Price
Showing 56 properties
| Address | Type | Beds | Baths | Last Sale Price | Last Sale Date | |
|---|---|---|---|---|---|---|
| 3 Kent Street, Plaistow, London, E13 8RL | Terraced | 4 | 2 | £450,000 | Feb 2024 | |
| 10 Kent Street, Plaistow, London, E13 8RL | Flat | 1 | 1 | £260,000 | Apr 2022 | |
| 42 Kent Street, Plaistow, London, E13 8RL | Maisonette | 2 | - | £310,000 | Apr 2018 | |
| 27 Kent Street, Plaistow, London, E13 8RL | Terraced | 3 | 1 | £395,000 | Jan 2017 | |
| 36 Kent Street, Plaistow, London, E13 8RL | Flat | 1 | - | £150,000 | Aug 2014 | |
| 60 Kent Street, Plaistow, London, E13 8RL | Flat | - | - | £182,500 | Mar 2014 | |
| 1 Kent Street, Plaistow, London, E13 8RL | Terraced | 4 | 2 | £240,000 | Sep 2009 | |
| 28 Kent Street, Plaistow, London, E13 8RL | Flat | - | - | £200,000 | Nov 2007 | |
| 54 Kent Street, Plaistow, London, E13 8RL | Maisonette | 2 | - | £119,995 | Jan 2007 | |
| 23 Kent Street, Plaistow, London, E13 8RL | Terraced | - | - | £200,000 | May 2006 |
Page 1 of 6
Energy Efficiency in E13 8RL
Amenities
Schools
| Rank | School | Type | Entry gender | Ages |
|---|
Explore more schools in this area
Go to Schools tabDemographics
Household Size
Family (3-5 people)
most common
Accommodation Type
Houses
most common
Tenure
37
majority
Ethnic Group
White
most common
Religion
N/A
most common
Household Composition
N/A
most common
Age
47
median
Adults (30-64 years)
most common
Household Deprivation
N/A
with no deprivation
NS-SEC
19
in Lower managerial occupations
Explore more demographic insights in this area
Go to Demographics tabPlanning
Planning Constraints
- Flood RiskPremium
- Ramsar Wetland SitesPremium
- Area of Outstanding Natural BeautyPremium
- Protected Nature ReservePremium
- Protected WoodlandPremium