Area Overview for Harlow
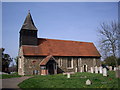
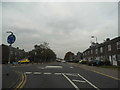
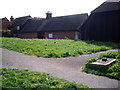
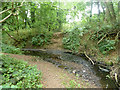
Photos of Harlow


Area Information
Harlow is a borough unitary authority covering an area of just 19.3 km². It hosts a population of 4,577 residents, resulting in a population density of 237 people per km². This small administrative district forms a distinct local community in England. Living in Harlow means navigating a compact environment where residents and services interact closely. The area functions as a self-contained locality with specific administrative boundaries. You will find a tight-knit neighbourhood structure where the scale of the borough influences daily interactions. The overall size suggests limited sprawl compared to larger metropolitan districts. Residents move through an area where the footprint is defined by its status as a local authority district. Households share the space efficiently within these geographic constraints. The population figure indicates a moderate number of people occupying the available housing stock. Life here revolves around the practicalities of living in a defined borough boundary. You experience the benefits of a smaller administrative unit while dealing with the realities of a residential population. The community layout supports a specific way of living that differs from more expansive urban zones. Understanding these physical dimensions helps you grasp the true nature of daily life in this specific part of England.
- Area Type
- Built Up Area 250
- Area Size
- 19.3 km²
- Population
- 4577
- Population Density
- 237 people/km²
Amenities
Schools
| Rank | School | Type | Entry gender | Ages |
|---|
Explore more schools in this area
Go to Schools tabDemographics
The community in Harlow presents a significant demographic profile, with a median age of 70. This indicates a population composed largely of older individuals. The most common age range identified is simply described as Age: Total, suggesting the data aggregates the entire population without finer segmentation. You encounter an environment where the typical resident is an older adult. This age structure influences local services, leisure choices, and community events. Home ownership stands at 58% across the district. More than half of the households own their homes rather than renting. This high level of ownership suggests long-term stability and a commitment to the area. The remaining 42% live in rental accommodation, creating a mixed but predominantly owner-occupied market. Household composition data covers the total population, reflecting the broad range of family and single-person setups present. Accommodation types are assessed across the total area, showing the variety of housing units available. Diversity metrics cover the total ethnic groups and religion statistics for the area. While specific breakdowns are not detailed beyond the totals, the existence of these categories confirms a recorded population with multiple backgrounds and beliefs. The combination of an elderly demographic, high ownership rates, and diverse ethnic makeup creates a unique social fabric. You will see a community where stability meets diversity in a district of its specific size.
Household Size
Accommodation Type
Tenure
Ethnic Group
Religion
Household Composition
Age
Household Deprivation
NS-SEC
Explore more demographic insights in this area
Go to Demographics tabPlanning
Planning Constraints
- Crime RiskPremium