Area Overview for CB9 9SA
Photos of CB9 9SA
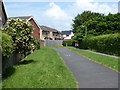
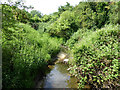
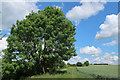
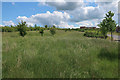
24 photos from this area
Area Information
Key information about the CB9 9SA including its size, population, and administrative classification.
- Area Type
- Postcode
- Area Size
- 1.1 hectares
- Population
- 2761
- Population Density
- 2702 people/km²
House Prices in CB9 9SA
25
Properties
£235,187
Average Sold Price
£92,000
Lowest Price
£392,000
Highest Price
Showing 25 properties
| Address | Type | Beds | Baths | Last Sale Price | Last Sale Date | |
|---|---|---|---|---|---|---|
| 32 Billings Close, Haverhill, CB9 9SA | Terraced | 3 | 1 | £305,000 | Jul 2025 | |
| 5 Billings Close, Haverhill, CB9 9SA | Terraced | 2 | 1 | £92,000 | May 2024 | |
| 24 Billings Close, Haverhill, CB9 9SA | Semi-detached | 5 | 3 | £392,000 | Mar 2024 | |
| 19 Billings Close, Haverhill, CB9 9SA | Terraced | 3 | 1 | £293,500 | Dec 2022 | |
| 6 Billings Close, Haverhill, CB9 9SA | house | 2 | - | £222,500 | Sep 2022 | |
| 22 Billings Close, Haverhill, CB9 9SA | Detached | 5 | 3 | £385,000 | Jul 2022 | |
| 26 Billings Close, Haverhill, CB9 9SA | Terraced | 3 | 2 | £254,000 | Sep 2021 | |
| 16 Billings Close, Haverhill, CB9 9SA | house | - | - | £359,950 | Mar 2021 | |
| 18 Billings Close, Haverhill, CB9 9SA | Detached | 5 | 3 | £369,000 | Sep 2019 | |
| 20 Billings Close, Haverhill, CB9 9SA | Detached | 5 | 2 | £355,000 | May 2017 |
Page 1 of 3
Energy Efficiency in CB9 9SA
Amenities
Schools
| Rank | School | Type | Entry gender | Ages |
|---|
Explore more schools in this area
Go to Schools tabDemographics
Household Size
Family (3-5 people)
most common
Accommodation Type
Houses
most common
Tenure
57
majority
Ethnic Group
White
most common
Religion
N/A
most common
Household Composition
N/A
most common
Age
47
median
Adults (30-64 years)
most common
Household Deprivation
N/A
with no deprivation
NS-SEC
28
in Lower managerial occupations
Explore more demographic insights in this area
Go to Demographics tabPlanning
Planning Constraints
- Flood RiskPremium
- Ramsar Wetland SitesPremium
- Area of Outstanding Natural BeautyPremium
- Protected Nature ReservePremium
- Protected WoodlandPremium