Area Overview for LE12 5QA
Photos of LE12 5QA
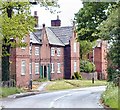
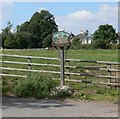
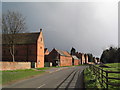
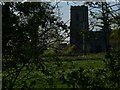


48 photos from this area
Area Information
Key information about the LE12 5QA including its size, population, and administrative classification.
- Area Type
- Postcode
- Area Size
- 4.0 hectares
- Population
- 1347
- Population Density
- 66 people/km²
House Prices in LE12 5QA
10
Properties
£503,936
Average Sold Price
£245,000
Lowest Price
£757,500
Highest Price
Showing 10 properties
| Address | Type | Beds | Baths | Last Sale Price | Last Sale Date | |
|---|---|---|---|---|---|---|
| Byre Barn, Village Farm Close, Stanford On Soar, LE12 5QA | Semi-detached | 3 | 2 | £400,000 | Apr 2018 | |
| Kingsbrooke, Village Farm Close, Stanford On Soar, LE12 5QA | house | - | - | £757,500 | Jan 2018 | |
| Hoton View, Village Farm Close, Stanford On Soar, LE12 5QA | Detached | - | - | £745,000 | Jan 2015 | |
| The Creamery, Village Farm Close, Stanford On Soar, LE12 5QA | Detached | - | - | £245,000 | Jul 2014 | |
| Spinney View, Village Farm Close, Stanford On Soar, LE12 5QA | house | - | - | £724,355 | Apr 2013 | |
| The Tythings, Village Farm Close, Stanford On Soar, LE12 5QA | house | - | - | £660,000 | Feb 2013 | |
| The Dairy, Village Farm Close, Stanford On Soar, LE12 5QA | house | - | - | £595,000 | Oct 2012 | |
| Moat Hill, Village Farm Close, Stanford On Soar, LE12 5QA | Detached | 5 | 4 | £300,000 | Oct 2012 | |
| The Barley Hopper, Village Farm Close, Stanford On Soar, LE12 5QA | Detached | - | - | £362,500 | Jul 2011 | |
| The Stables, Village Farm Close, Stanford On Soar, LE12 5QA | Detached | - | - | £250,000 | May 2011 |
Energy Efficiency in LE12 5QA
Amenities
Schools
| Rank | School | Type | Entry gender | Ages |
|---|
Explore more schools in this area
Go to Schools tabDemographics
Household Size
Two person
most common
Accommodation Type
Houses
most common
Tenure
80
majority
Ethnic Group
White
most common
Religion
N/A
most common
Household Composition
N/A
most common
Age
47
median
Adults (30-64 years)
most common
Household Deprivation
N/A
with no deprivation
NS-SEC
48
in Lower managerial occupations
Explore more demographic insights in this area
Go to Demographics tabPlanning
Planning Constraints
- Flood RiskPremium
- Ramsar Wetland SitesPremium
- Area of Outstanding Natural BeautyPremium
- Protected Nature ReservePremium
- Protected WoodlandPremium