Area Overview for YO18 7RT
Photos of YO18 7RT
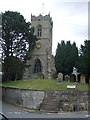
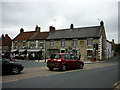

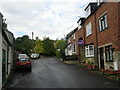
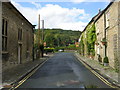


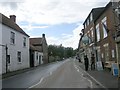
100 photos from this area
Area Information
Key information about the YO18 7RT including its size, population, and administrative classification.
- Area Type
- Postcode
- Area Size
- 23.0 hectares
- Population
- 1742
- Population Density
- 57 people/km²
House Prices in YO18 7RT
17
Properties
£253,400
Average Sold Price
£2,000
Lowest Price
£530,000
Highest Price
Showing 17 properties
| Address | Type | Beds | Baths | Last Sale Price | Last Sale Date | |
|---|---|---|---|---|---|---|
| Midstream Cottage, Priestmans Lane, Thornton Le Dale, YO18 7RT | house | - | - | £2,000 | Mar 2018 | |
| Kirkby House, Priestmans Lane, Thornton Le Dale, YO18 7RT | Detached | - | - | £405,000 | Oct 2006 | |
| Beck Hall, Priestmans Lane, Thornton Le Dale, YO18 7RT | Semi-detached | - | - | £140,000 | Mar 2006 | |
| Brook House, Priestmans Lane, Thornton Le Dale, YO18 7RT | Detached | - | - | £530,000 | Oct 2003 | |
| Millers Hill, Priestmans Lane, Thornton Le Dale, YO18 7RT | Detached | - | - | £190,000 | Sep 1996 | |
| Wayside, Priestmans Lane, Thornton Le Dale, YO18 7RT | house | - | - | - | - | |
| Ellerbeck House, Priestmans Lane, Thornton Le Dale, YO18 7RT | Detached | - | - | - | - | |
| Walnut Cottage, Priestmans Lane, Thornton Le Dale, YO18 7RT | Detached | - | - | - | - | |
| Apartment 3, Victory Mill, Priestmans Lane, Thornton Le Dale, YO18 7RT | Flat | - | - | - | - | |
| Apartment 2, Victory Mill, Priestmans Lane, Thornton Le Dale, YO18 7RT | Flat | - | - | - | - |
Page 1 of 2
Energy Efficiency in YO18 7RT
Amenities
Schools
| Rank | School | Type | Entry gender | Ages |
|---|
Explore more schools in this area
Go to Schools tabDemographics
Household Size
Two person
most common
Accommodation Type
Houses
most common
Tenure
79
majority
Ethnic Group
White
most common
Religion
N/A
most common
Household Composition
N/A
most common
Age
47
median
Elderly (65+ years)
most common
Household Deprivation
N/A
with no deprivation
NS-SEC
38
in Lower managerial occupations
Explore more demographic insights in this area
Go to Demographics tabPlanning
Planning Constraints
- Flood RiskPremium
- Ramsar Wetland SitesPremium
- Area of Outstanding Natural BeautyPremium
- Protected Nature ReservePremium
- Protected WoodlandPremium