Area Overview for YO17 6PN
Photos of YO17 6PN
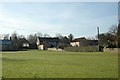
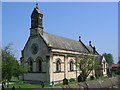
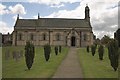
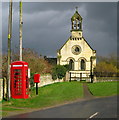

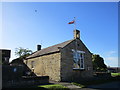
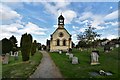
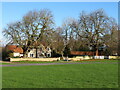
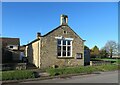
33 photos from this area
Area Information
Key information about the YO17 6PN including its size, population, and administrative classification.
- Area Type
- Postcode
- Area Size
- 3.9 hectares
- Population
- 1700
- Population Density
- 31 people/km²
House Prices in YO17 6PN
9
Properties
£225,000
Average Sold Price
£185,000
Lowest Price
£265,000
Highest Price
Showing 9 properties
| Address | Type | Beds | Baths | Last Sale Price | Last Sale Date | |
|---|---|---|---|---|---|---|
| The Cottage, Main Street, Barton Le Street, YO17 6PN | house | - | - | £185,000 | Nov 2014 | |
| Rectory Cottage, Main Street, Barton Le Street, YO17 6PN | Detached | - | - | £265,000 | Sep 2007 | |
| Stainton Cottage, Main Street, Barton Le Street, YO17 6PN | house | - | - | - | - | |
| Ivy House, Back Lane, Barton Le Street, YO17 6PN | Detached | - | - | - | - | |
| Stainton House, Main Street, Barton Le Street, YO17 6PN | house | - | - | - | - | |
| 1, Brick Row, Village Street, Barton Le Street, YO17 6PN | house | 3 | - | - | - | |
| 2, Brick Row, Village Street, Barton Le Street, YO17 6PN | house | - | - | - | - | |
| 3, Brick Row, Village Street, Barton Le Street, YO17 6PN | house | - | - | - | - | |
| The Gables, Main Street, Barton Le Street, YO17 6PN | Detached | - | - | - | - |
Energy Efficiency in YO17 6PN
Amenities
Schools
| Rank | School | Type | Entry gender | Ages |
|---|
Explore more schools in this area
Go to Schools tabDemographics
Household Size
Two person
most common
Accommodation Type
Houses
most common
Tenure
67
majority
Ethnic Group
White
most common
Religion
N/A
most common
Household Composition
N/A
most common
Age
47
median
Adults (30-64 years)
most common
Household Deprivation
N/A
with no deprivation
NS-SEC
40
in Lower managerial occupations
Explore more demographic insights in this area
Go to Demographics tabPlanning
Planning Constraints
- Flood RiskPremium
- Ramsar Wetland SitesPremium
- Area of Outstanding Natural BeautyPremium
- Protected Nature ReservePremium
- Protected WoodlandPremium