Area Overview for HU10 6TA
Photos of HU10 6TA
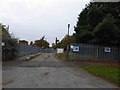
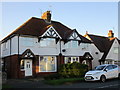
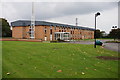
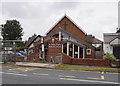
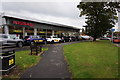
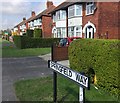
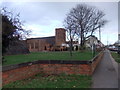
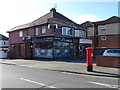
67 photos from this area
Area Information
Key information about the HU10 6TA including its size, population, and administrative classification.
- Area Type
- Postcode
- Area Size
- 1.9 hectares
- Population
- 1186
- Population Density
- 1132 people/km²
House Prices in HU10 6TA
48
Properties
£101,109
Average Sold Price
£24,000
Lowest Price
£156,000
Highest Price
Showing 48 properties
| Address | Type | Beds | Baths | Last Sale Price | Last Sale Date | |
|---|---|---|---|---|---|---|
| 7 Dawnay Drive, Anlaby, HU10 6TA | Terraced | 3 | 1 | £139,000 | Apr 2023 | |
| 61 Dawnay Drive, Anlaby, HU10 6TA | Retail | 3 | 1 | £119,000 | Jul 2022 | |
| 25 Dawnay Drive, Anlaby, HU10 6TA | house | - | - | £156,000 | Jun 2022 | |
| 95 Dawnay Drive, Anlaby, HU10 6TA | house | 3 | - | £153,000 | Nov 2021 | |
| 55 Dawnay Drive, Anlaby, HU10 6TA | house | - | - | £125,000 | Aug 2021 | |
| 93 Dawnay Drive, Anlaby, HU10 6TA | Flat | - | - | £66,500 | Jun 2020 | |
| 97 Dawnay Drive, Anlaby, HU10 6TA | Terraced | 3 | 1 | £130,000 | Mar 2020 | |
| 5 Dawnay Drive, Anlaby, HU10 6TA | Terraced | 2 | 1 | £128,500 | Nov 2019 | |
| 19 Dawnay Drive, Anlaby, HU10 6TA | Terraced | 3 | 1 | £119,000 | Mar 2019 | |
| 71 Dawnay Drive, Anlaby, HU10 6TA | house | - | - | £115,000 | Feb 2015 |
Page 1 of 5
Energy Efficiency in HU10 6TA
Amenities
Schools
| Rank | School | Type | Entry gender | Ages |
|---|
Explore more schools in this area
Go to Schools tabDemographics
Household Size
Family (3-5 people)
most common
Accommodation Type
Houses
most common
Tenure
66
majority
Ethnic Group
White
most common
Religion
N/A
most common
Household Composition
N/A
most common
Age
47
median
Adults (30-64 years)
most common
Household Deprivation
N/A
with no deprivation
NS-SEC
25
in Lower managerial occupations
Explore more demographic insights in this area
Go to Demographics tabPlanning
Planning Constraints
- Flood RiskPremium
- Ramsar Wetland SitesPremium
- Area of Outstanding Natural BeautyPremium
- Protected Nature ReservePremium
- Protected WoodlandPremium