Area Overview for TQ9 7JW
Photos of TQ9 7JW
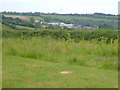
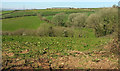
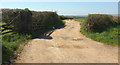
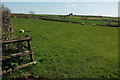
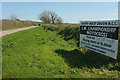
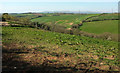
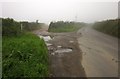
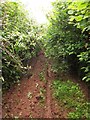

15 photos from this area
Area Information
Key information about the TQ9 7JW including its size, population, and administrative classification.
- Area Type
- Postcode
- Area Size
- 1.0 km²
- Population
- 2466
- Population Density
- 46 people/km²
House Prices in TQ9 7JW
8
Properties
£430,000
Average Sold Price
£275,000
Lowest Price
£585,000
Highest Price
Showing 8 properties
| Address | Type | Beds | Baths | Last Sale Price | Last Sale Date | |
|---|---|---|---|---|---|---|
| Abbey Moor, Back Road, Moreleigh, TQ9 7JW | Bungalow | 3 | 1 | £585,000 | Dec 2018 | |
| Farleigh Croft, Farleigh Service Road, Moreleigh, TQ9 7JW | Detached | - | - | £275,000 | Jan 2007 | |
| Lower Farleigh, Farleigh Service Road, Moreleigh, TQ9 7JW | general_industrial | - | - | - | - | |
| Higher Farleigh Farm, Farleigh Service Road, Moreleigh, TQ9 7JW | house | - | - | - | - | |
| Moorview, Lower Farleigh, Farleigh Service Road, Moreleigh, TQ9 7JW | Terraced | - | - | - | - | |
| Barn Cottage, Lower Farleigh, Farleigh Service Road, Moreleigh, TQ9 7JW | Terraced | - | - | - | - | |
| The Paddocks, Back Road, Moreleigh, TQ9 7JW | Bungalow | - | - | - | - | |
| Mobile Home At Sx 7579 5346, Farleigh Service Road, Moreleigh, TQ9 7JW | Mobile Home | - | - | - | - |
Energy Efficiency in TQ9 7JW
Amenities
Schools
| Rank | School | Type | Entry gender | Ages |
|---|
Explore more schools in this area
Go to Schools tabDemographics
Household Size
Two person
most common
Accommodation Type
Houses
most common
Tenure
73
majority
Ethnic Group
White
most common
Religion
N/A
most common
Household Composition
N/A
most common
Age
47
median
Adults (30-64 years)
most common
Household Deprivation
N/A
with no deprivation
NS-SEC
43
in Lower managerial occupations
Explore more demographic insights in this area
Go to Demographics tabPlanning
Planning Constraints
- Flood RiskPremium
- Ramsar Wetland SitesPremium
- Area of Outstanding Natural BeautyPremium
- Protected Nature ReservePremium
- Protected WoodlandPremium