Area Overview for TQ5 0LP
Photos of TQ5 0LP
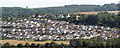
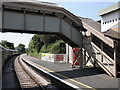
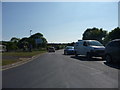
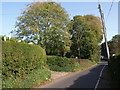
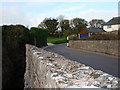
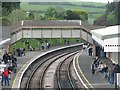
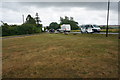
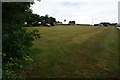
100 photos from this area
Area Information
Key information about the TQ5 0LP including its size, population, and administrative classification.
- Area Type
- Postcode
- Area Size
- 2.4 hectares
- Population
- 1243
- Population Density
- 260 people/km²
House Prices in TQ5 0LP
13
Properties
£433,667
Average Sold Price
£107,500
Lowest Price
£895,000
Highest Price
Showing 13 properties
| Address | Type | Beds | Baths | Last Sale Price | Last Sale Date | |
|---|---|---|---|---|---|---|
| 2 Churston Close, Brixham, TQ5 0LP | Bungalow | 4 | 2 | £690,000 | Sep 2025 | |
| 10 Churston Close, Brixham, TQ5 0LP | house | - | - | £895,000 | Feb 2021 | |
| 7 Churston Close, Brixham, TQ5 0LP | Bungalow | 3 | 1 | £510,000 | May 2020 | |
| 8 Churston Close, Brixham, TQ5 0LP | Detached | 3 | - | £265,000 | Mar 2013 | |
| 4 Churston Close, Brixham, TQ5 0LP | Bungalow | - | - | £134,500 | May 2000 | |
| 1 Churston Close, Brixham, TQ5 0LP | Detached | - | - | £107,500 | Jan 2000 | |
| 3 Churston Close, Brixham, TQ5 0LP | Detached | - | - | - | - | |
| 5 Churston Close, Brixham, TQ5 0LP | Detached | - | - | - | - | |
| 11 Churston Close, Brixham, TQ5 0LP | Detached | - | - | - | - | |
| 13 Churston Close, Brixham, TQ5 0LP | Detached | - | - | - | - |
Page 1 of 2
Energy Efficiency in TQ5 0LP
Amenities
Schools
| Rank | School | Type | Entry gender | Ages |
|---|
Explore more schools in this area
Go to Schools tabDemographics
Household Size
Two person
most common
Accommodation Type
Houses
most common
Tenure
78
majority
Ethnic Group
White
most common
Religion
N/A
most common
Household Composition
N/A
most common
Age
47
median
Elderly (65+ years)
most common
Household Deprivation
N/A
with no deprivation
NS-SEC
36
in Lower managerial occupations
Explore more demographic insights in this area
Go to Demographics tabPlanning
Planning Constraints
- Flood RiskPremium
- Ramsar Wetland SitesPremium
- Area of Outstanding Natural BeautyPremium
- Protected Nature ReservePremium
- Protected WoodlandPremium