Area Overview for TQ2 6PS
Photos of TQ2 6PS
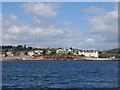
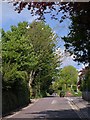
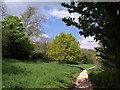
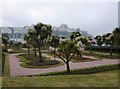

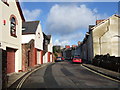
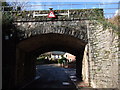
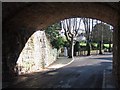
100 photos from this area
Area Information
Key information about the TQ2 6PS including its size, population, and administrative classification.
- Area Type
- Postcode
- Area Size
- 2.3 hectares
- Population
- 1980
- Population Density
- 1328 people/km²
House Prices in TQ2 6PS
34
Properties
£539,375
Average Sold Price
£299,000
Lowest Price
£790,000
Highest Price
Showing 34 properties
| Address | Type | Beds | Baths | Last Sale Price | Last Sale Date | |
|---|---|---|---|---|---|---|
| White Gables, Seaway Lane, Torquay, TQ2 6PS | house | - | - | £790,000 | Mar 2023 | |
| Timbertops, Seaway Lane, Torquay, TQ2 6PS | house | - | - | £750,000 | Jun 2021 | |
| Newlands, Seaway Lane, Torquay, TQ2 6PS | Semi-detached | 7 | 6 | £521,000 | Jul 2013 | |
| Trevone, Seaway Lane, Torquay, TQ2 6PS | house | - | - | £320,000 | May 2010 | |
| Monterey, Seaway Lane, Torquay, TQ2 6PS | Semi-detached | - | - | £299,000 | Aug 2007 | |
| Meadow Pines, Seaway Lane, Torquay, TQ2 6PS | house | - | - | £635,000 | May 2004 | |
| Shangri-la, Seaway Lane, Torquay, TQ2 6PS | Bungalow | - | - | £370,000 | Sep 2003 | |
| Elmbrae, Seaway Lane, Torquay, TQ2 6PS | house | 4 | - | £630,000 | May 2003 | |
| The Brunel Tower, 17 The Manor House Apartments, Seaway Lane, Torquay, TQ2 6PS | Flat | 4 | 2 | - | - | |
| 13, The Manor House Apartments, Seaway Lane, Torquay, TQ2 6PS | Flat | 1 | 1 | - | - |
Page 1 of 4
Energy Efficiency in TQ2 6PS
Amenities
Schools
| Rank | School | Type | Entry gender | Ages |
|---|
Explore more schools in this area
Go to Schools tabDemographics
Household Size
Two person
most common
Accommodation Type
Houses
most common
Tenure
88
majority
Ethnic Group
White
most common
Religion
N/A
most common
Household Composition
N/A
most common
Age
47
median
Elderly (65+ years)
most common
Household Deprivation
N/A
with no deprivation
NS-SEC
42
in Lower managerial occupations
Explore more demographic insights in this area
Go to Demographics tabPlanning
Planning Constraints
- Flood RiskPremium
- Ramsar Wetland SitesPremium
- Area of Outstanding Natural BeautyPremium
- Protected Nature ReservePremium
- Protected WoodlandPremium