Area Overview for TQ14 9SH
Photos of TQ14 9SH

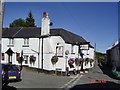
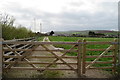
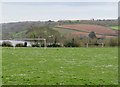
87 photos from this area
Area Information
Key information about the TQ14 9SH including its size, population, and administrative classification.
- Area Type
- Postcode
- Area Size
- 3.0 hectares
- Population
- 1561
- Population Density
- 403 people/km²
House Prices in TQ14 9SH
35
Properties
£483,763
Average Sold Price
£112,500
Lowest Price
£1,350,000
Highest Price
Showing 35 properties
| Address | Type | Beds | Baths | Last Sale Price | Last Sale Date | |
|---|---|---|---|---|---|---|
| Blue Hills, 30 Murley Crescent, Bishopsteignton, TQ14 9SH | house | - | - | £1,350,000 | Jul 2023 | |
| Hartland, 18 Murley Crescent, Bishopsteignton, TQ14 9SH | house | - | - | £550,000 | Jan 2023 | |
| Heronsgate, 29 Murley Crescent, Bishopsteignton, TQ14 9SH | house | 4 | 1 | £791,250 | Nov 2022 | |
| The Navigators House, 2 Murley Crescent, Bishopsteignton, TQ14 9SH | Retail | 5 | 3 | £640,000 | Jul 2022 | |
| Silverdale, 17 Murley Crescent, Bishopsteignton, TQ14 9SH | Semi-detached | 3 | 1 | £532,500 | May 2022 | |
| Beam Reach, 21 Murley Crescent, Bishopsteignton, TQ14 9SH | house | - | - | £1,100,000 | Aug 2020 | |
| St Michael, 27 Murley Crescent, Bishopsteignton, TQ14 9SH | Bungalow | 4 | - | £510,000 | Aug 2020 | |
| Riverview, 3 Murley Crescent, Bishopsteignton, TQ14 9SH | Bungalow | 4 | 2 | £470,000 | Jun 2019 | |
| Valden, 1 Murley Crescent, Bishopsteignton, TQ14 9SH | Bungalow | 3 | 2 | £377,000 | Oct 2017 | |
| Davidia, 32 Murley Crescent, Bishopsteignton, TQ14 9SH | Detached | 5 | - | £363,500 | Dec 2016 |
Page 1 of 4
Energy Efficiency in TQ14 9SH
Amenities
Schools
| Rank | School | Type | Entry gender | Ages |
|---|
Explore more schools in this area
Go to Schools tabDemographics
Household Size
Two person
most common
Accommodation Type
Houses
most common
Tenure
89
majority
Ethnic Group
White
most common
Religion
N/A
most common
Household Composition
N/A
most common
Age
47
median
Elderly (65+ years)
most common
Household Deprivation
N/A
with no deprivation
NS-SEC
42
in Lower managerial occupations
Explore more demographic insights in this area
Go to Demographics tabPlanning
Planning Constraints
- Flood RiskPremium
- Ramsar Wetland SitesPremium
- Area of Outstanding Natural BeautyPremium
- Protected Nature ReservePremium
- Protected WoodlandPremium