Area Overview for TQ1 4QQ
Photos of TQ1 4QQ


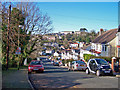
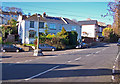

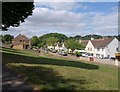
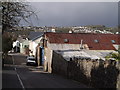
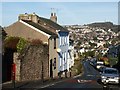


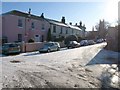
100 photos from this area
Area Information
Key information about the TQ1 4QQ including its size, population, and administrative classification.
- Area Type
- Postcode
- Area Size
- 7329 m²
- Population
- 1689
- Population Density
- 6060 people/km²
House Prices in TQ1 4QQ
38
Properties
£150,307
Average Sold Price
£40,500
Lowest Price
£325,000
Highest Price
Showing 38 properties
| Address | Type | Beds | Baths | Last Sale Price | Last Sale Date | |
|---|---|---|---|---|---|---|
| 36 Hartop Road, St Marychurch, Torquay, TQ1 4QQ | Terraced | 2 | 1 | £180,000 | Dec 2025 | |
| 32 Hartop Road, St Marychurch, Torquay, TQ1 4QQ | Terraced | 2 | 1 | £220,000 | Feb 2025 | |
| 40 Hartop Road, St Marychurch, Torquay, TQ1 4QQ | Terraced | 3 | 1 | £290,000 | Feb 2025 | |
| 50 Hartop Road, St Marychurch, Torquay, TQ1 4QQ | Semi-detached | 2 | 1 | £200,000 | Sep 2024 | |
| 54 Hartop Road, St Marychurch, Torquay, TQ1 4QQ | house | 3 | 1 | £272,000 | Dec 2022 | |
| 14A Hartop Road, St Marychurch, Torquay, TQ1 4QQ | Terraced | 3 | 2 | £265,000 | Dec 2022 | |
| 46 Hartop Road, St Marychurch, Torquay, TQ1 4QQ | Terraced | 3 | 1 | £225,000 | Oct 2021 | |
| 16A Hartop Road, St Marychurch, Torquay, TQ1 4QQ | Bungalow | - | - | £325,000 | Dec 2020 | |
| 38 Hartop Road, St Marychurch, Torquay, TQ1 4QQ | Terraced | 2 | 1 | £194,950 | Nov 2020 | |
| 20 Hartop Road, St Marychurch, Torquay, TQ1 4QQ | Terraced | 2 | 1 | £116,000 | Jul 2020 |
Page 1 of 4
Energy Efficiency in TQ1 4QQ
Amenities
Schools
| Rank | School | Type | Entry gender | Ages |
|---|
Explore more schools in this area
Go to Schools tabDemographics
Household Size
One person
most common
Accommodation Type
Flats
most common
Tenure
49
majority
Ethnic Group
White
most common
Religion
N/A
most common
Household Composition
N/A
most common
Age
47
median
Elderly (65+ years)
most common
Household Deprivation
N/A
with no deprivation
NS-SEC
25
in Lower managerial occupations
Explore more demographic insights in this area
Go to Demographics tabPlanning
Planning Constraints
- Flood RiskPremium
- Ramsar Wetland SitesPremium
- Area of Outstanding Natural BeautyPremium
- Protected Nature ReservePremium
- Protected WoodlandPremium