Area Overview for TQ1 4PU
Photos of TQ1 4PU
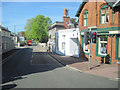
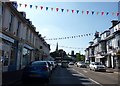
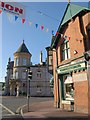
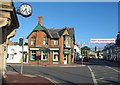
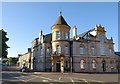
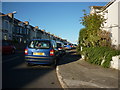
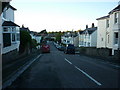
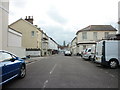
100 photos from this area
Area Information
Key information about the TQ1 4PU including its size, population, and administrative classification.
- Area Type
- Postcode
- Area Size
- 6661 m²
- Population
- 1689
- Population Density
- 6060 people/km²
House Prices in TQ1 4PU
71
Properties
£124,510
Average Sold Price
£51,568
Lowest Price
£200,000
Highest Price
Showing 71 properties
| Address | Type | Beds | Baths | Last Sale Price | Last Sale Date | |
|---|---|---|---|---|---|---|
| 67 Fore Street, St Marychurch, Torquay, TQ1 4PU | Cottage | 2 | 1 | £185,000 | Mar 2025 | |
| 69 Fore Street, St Marychurch, Torquay, TQ1 4PU | Terraced | 1 | 1 | £100,000 | Feb 2025 | |
| 71 Fore Street, St Marychurch, Torquay, TQ1 4PU | Terraced | 2 | 2 | £200,000 | Jul 2023 | |
| 61 Fore Street, St Marychurch, Torquay, TQ1 4PU | Terraced | 3 | 1 | £125,000 | Aug 2015 | |
| 73A Fore Street, St Marychurch, Torquay, TQ1 4PU | house | - | - | £98,000 | Oct 2014 | |
| 59 Fore Street, St Marychurch, Torquay, TQ1 4PU | Cottage | 1 | 1 | £51,568 | Aug 2004 | |
| 21A Fore Street, St Marychurch, Torquay, TQ1 4PU | Flat | - | - | £112,000 | Mar 1998 | |
| Floor, 23 Fore Street, St Marychurch, Torquay, TQ1 4PU | Terraced | - | - | - | - | |
| 75 Fore Street, St Marychurch, Torquay, TQ1 4PU | Terraced | 4 | - | - | - | |
| 27A Fore Street, St Marychurch, Torquay, TQ1 4PU | Maisonette | - | - | - | - |
Page 1 of 8
Energy Efficiency in TQ1 4PU
Amenities
Schools
| Rank | School | Type | Entry gender | Ages |
|---|
Explore more schools in this area
Go to Schools tabDemographics
Household Size
One person
most common
Accommodation Type
Flats
most common
Tenure
49
majority
Ethnic Group
White
most common
Religion
N/A
most common
Household Composition
N/A
most common
Age
47
median
Elderly (65+ years)
most common
Household Deprivation
N/A
with no deprivation
NS-SEC
25
in Lower managerial occupations
Explore more demographic insights in this area
Go to Demographics tabPlanning
Planning Constraints
- Flood RiskPremium
- Ramsar Wetland SitesPremium
- Area of Outstanding Natural BeautyPremium
- Protected Nature ReservePremium
- Protected WoodlandPremium