Area Overview for TQ1 4PB
Photos of TQ1 4PB


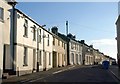
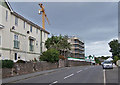
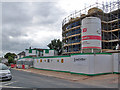
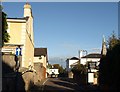

100 photos from this area
Area Information
Key information about the TQ1 4PB including its size, population, and administrative classification.
- Area Type
- Postcode
- Area Size
- 6809 m²
- Population
- 1357
- Population Density
- 4435 people/km²
House Prices in TQ1 4PB
13
Properties
£251,355
Average Sold Price
£159,950
Lowest Price
£310,000
Highest Price
Showing 13 properties
| Address | Type | Beds | Baths | Last Sale Price | Last Sale Date | |
|---|---|---|---|---|---|---|
| 14 Barewell Close, St Marychurch, Torquay, TQ1 4PB | Bungalow | 2 | 1 | £295,000 | Sep 2024 | |
| 3 Barewell Close, St Marychurch, Torquay, TQ1 4PB | Bungalow | 2 | 1 | £310,000 | May 2023 | |
| 9 Barewell Close, St Marychurch, Torquay, TQ1 4PB | Semi-detached | 4 | 1 | £250,000 | Oct 2021 | |
| 5 Barewell Close, St Marychurch, Torquay, TQ1 4PB | Bungalow | 2 | - | £297,000 | Sep 2021 | |
| 6 Barewell Close, St Marychurch, Torquay, TQ1 4PB | Semi-detached | 3 | 1 | £275,000 | Oct 2019 | |
| 7 Barewell Close, St Marychurch, Torquay, TQ1 4PB | Semi-detached | 2 | 1 | £235,000 | Nov 2018 | |
| 10 Barewell Close, St Marychurch, Torquay, TQ1 4PB | Bungalow | 3 | - | £295,000 | Jul 2016 | |
| 8 Barewell Close, St Marychurch, Torquay, TQ1 4PB | Semi-detached | 3 | - | £240,000 | Oct 2015 | |
| 12 Barewell Close, St Marychurch, Torquay, TQ1 4PB | Bungalow | - | - | £212,950 | Sep 2009 | |
| 18 Barewell Close, St Marychurch, Torquay, TQ1 4PB | Bungalow | 3 | - | £195,000 | Jul 2006 |
Page 1 of 2
Energy Efficiency in TQ1 4PB
Amenities
Schools
| Rank | School | Type | Entry gender | Ages |
|---|
Explore more schools in this area
Go to Schools tabDemographics
Household Size
Two person
most common
Accommodation Type
Houses
most common
Tenure
65
majority
Ethnic Group
White
most common
Religion
N/A
most common
Household Composition
N/A
most common
Age
47
median
Adults (30-64 years)
most common
Household Deprivation
N/A
with no deprivation
NS-SEC
31
in Lower managerial occupations
Explore more demographic insights in this area
Go to Demographics tabPlanning
Planning Constraints
- Flood RiskPremium
- Ramsar Wetland SitesPremium
- Area of Outstanding Natural BeautyPremium
- Protected Nature ReservePremium
- Protected WoodlandPremium