Area Overview for TQ1 3JT
Photos of TQ1 3JT


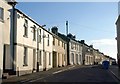
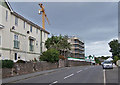
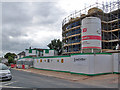
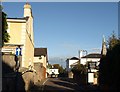
100 photos from this area
Area Information
Key information about the TQ1 3JT including its size, population, and administrative classification.
- Area Type
- Postcode
- Area Size
- 1.4 hectares
- Population
- 1689
- Population Density
- 6060 people/km²
House Prices in TQ1 3JT
95
Properties
£232,313
Average Sold Price
£196,500
Lowest Price
£295,250
Highest Price
Showing 95 properties
| Address | Type | Beds | Baths | Last Sale Price | Last Sale Date | |
|---|---|---|---|---|---|---|
| 199A St Marychurch Road, Torquay, TQ1 3JT | Semi-detached | 1 | 1 | £207,500 | Nov 2017 | |
| 186 St Marychurch Road, Torquay, TQ1 3JT | Semi-detached | 3 | - | £295,250 | Apr 2016 | |
| 199 St Marychurch Road, Torquay, TQ1 3JT | house | 4 | - | £230,000 | Mar 2008 | |
| 203A St Marychurch Road, Torquay, TQ1 3JT | Detached | 4 | - | £196,500 | Jan 2002 | |
| 1, Priory Court, 184 St Marychurch Road, Torquay, TQ1 3JT | Terraced | 3 | 1 | - | - | |
| 16, Hayden Park, 213 St Marychurch Road, Torquay, TQ1 3JT | Flat | 2 | 1 | - | - | |
| Flat 3, Bishops Court, 180 St Marychurch Road, Torquay, TQ1 3JT | Flat | 1 | 1 | - | - | |
| Flat 2, 197 St Marychurch Road, Torquay, TQ1 3JT | Flat | 1 | 1 | - | - | |
| Flat 12, Bishops Court, 180 St Marychurch Road, Torquay, TQ1 3JT | Flat | 2 | 1 | - | - | |
| Flat 1, Berkshire Court, 205 St Marychurch Road, Torquay, TQ1 3JT | Flat | 2 | 1 | - | - |
Page 1 of 10
Energy Efficiency in TQ1 3JT
Amenities
Schools
| Rank | School | Type | Entry gender | Ages |
|---|
Explore more schools in this area
Go to Schools tabDemographics
Household Size
One person
most common
Accommodation Type
Flats
most common
Tenure
49
majority
Ethnic Group
White
most common
Religion
N/A
most common
Household Composition
N/A
most common
Age
47
median
Elderly (65+ years)
most common
Household Deprivation
N/A
with no deprivation
NS-SEC
25
in Lower managerial occupations
Explore more demographic insights in this area
Go to Demographics tabPlanning
Planning Constraints
- Flood RiskPremium
- Ramsar Wetland SitesPremium
- Area of Outstanding Natural BeautyPremium
- Protected Nature ReservePremium
- Protected WoodlandPremium