Area Overview for TQ1 2PS
Photos of TQ1 2PS
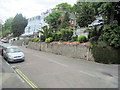
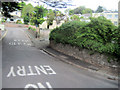
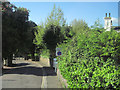
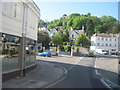
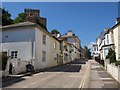
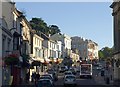
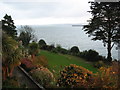
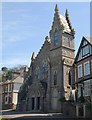
100 photos from this area
Area Information
Key information about the TQ1 2PS including its size, population, and administrative classification.
- Area Type
- Postcode
- Area Size
- 3558 m²
- Population
- 1695
- Population Density
- 2573 people/km²
House Prices in TQ1 2PS
25
Properties
£212,209
Average Sold Price
£139,950
Lowest Price
£320,000
Highest Price
Showing 25 properties
| Address | Type | Beds | Baths | Last Sale Price | Last Sale Date | |
|---|---|---|---|---|---|---|
| 26, Lisburne Place, Lisburne Square, Wellswood, Torquay, TQ1 2PS | Flat | 2 | 2 | £190,000 | Oct 2024 | |
| 15, Lisburne Place, Lisburne Square, Wellswood, Torquay, TQ1 2PS | Terraced | 3 | 2 | £249,950 | Jan 2023 | |
| 24, Lisburne Place, Lisburne Square, Wellswood, Torquay, TQ1 2PS | Flat | - | - | £240,000 | Dec 2022 | |
| 20, Lisburne Place, Lisburne Square, Wellswood, Torquay, TQ1 2PS | Retail | 3 | 2 | £195,000 | Jun 2022 | |
| 19, Lisburne Place, Lisburne Square, Wellswood, Torquay, TQ1 2PS | Semi-detached | 4 | 2 | £320,000 | Apr 2022 | |
| 8, Lisburne Place, Lisburne Square, Wellswood, Torquay, TQ1 2PS | Terraced | 3 | - | £247,500 | Jan 2022 | |
| 7, Lisburne Place, Lisburne Square, Wellswood, Torquay, TQ1 2PS | Terraced | 3 | 2 | £222,000 | Jun 2021 | |
| 16, LISBURNE PLACE, LISBURNE SQUARE, Wellswood, Torquay, TQ1 2PS | Terraced | 3 | - | £222,000 | Apr 2021 | |
| 4, Lisburne Place, Lisburne Square, Wellswood, Torquay, TQ1 2PS | Terraced | 3 | 2 | £225,000 | Jun 2020 | |
| 11, Lisburne Place, Lisburne Square, Wellswood, Torquay, TQ1 2PS | Terraced | 3 | 2 | £195,000 | Mar 2020 |
Page 1 of 3
Energy Efficiency in TQ1 2PS
Amenities
Schools
| Rank | School | Type | Entry gender | Ages |
|---|
Explore more schools in this area
Go to Schools tabDemographics
Household Size
One person
most common
Accommodation Type
Flats
most common
Tenure
60
majority
Ethnic Group
White
most common
Religion
N/A
most common
Household Composition
N/A
most common
Age
47
median
Adults (30-64 years)
most common
Household Deprivation
N/A
with no deprivation
NS-SEC
36
in Lower managerial occupations
Explore more demographic insights in this area
Go to Demographics tabPlanning
Planning Constraints
- Flood RiskPremium
- Ramsar Wetland SitesPremium
- Area of Outstanding Natural BeautyPremium
- Protected Nature ReservePremium
- Protected WoodlandPremium