Area Overview for TA9 4QU
Photos of TA9 4QU

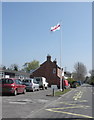
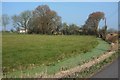
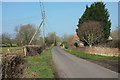
9 photos from this area
Area Information
Key information about the TA9 4QU including its size, population, and administrative classification.
- Area Type
- Postcode
- Area Size
- 12.2 hectares
- Population
- 1397
- Population Density
- 65 people/km²
House Prices in TA9 4QU
12
Properties
£361,938
Average Sold Price
£230,000
Lowest Price
£525,000
Highest Price
Showing 12 properties
| Address | Type | Beds | Baths | Last Sale Price | Last Sale Date | |
|---|---|---|---|---|---|---|
| The Ashes, Poplar Lane, Mark, Highbridge, TA9 4QU | Bungalow | 2 | - | £325,000 | Oct 2023 | |
| Causeway Lodge, Poplar Lane, Mark, Highbridge, TA9 4QU | house | - | - | £325,000 | Nov 2021 | |
| The Birches, Poplar Lane, Mark, Highbridge, TA9 4QU | house | 2 | 2 | £230,000 | Mar 2021 | |
| The Chestnuts, Poplar Lane, Mark, Highbridge, TA9 4QU | house | 5 | 3 | £525,000 | Sep 2016 | |
| Causeway Farm Cottage, Poplar Lane, Mark, Highbridge, TA9 4QU | Cottage | 4 | - | £472,500 | Nov 2015 | |
| The Willows, Poplar Lane, Mark, Highbridge, TA9 4QU | Detached | 4 | 3 | £275,000 | Sep 2015 | |
| The Firs, Poplar Lane, Mark, Highbridge, TA9 4QU | Detached | 4 | 2 | £326,000 | Jul 2015 | |
| Causeway House, Poplar Lane, Mark, Highbridge, TA9 4QU | house | - | - | £417,000 | Apr 2007 | |
| Brenmar, Poplar Lane, Mark, Highbridge, TA9 4QU | Semi-detached | 3 | 1 | - | - | |
| Barnstable Cottage, Poplar Lane, Mark, Highbridge, TA9 4QU | Detached | 3 | 2 | - | - |
Page 1 of 2
Energy Efficiency in TA9 4QU
Amenities
Schools
| Rank | School | Type | Entry gender | Ages |
|---|
Explore more schools in this area
Go to Schools tabDemographics
Household Size
Two person
most common
Accommodation Type
Houses
most common
Tenure
83
majority
Ethnic Group
White
most common
Religion
N/A
most common
Household Composition
N/A
most common
Age
47
median
Adults (30-64 years)
most common
Household Deprivation
N/A
with no deprivation
NS-SEC
36
in Lower managerial occupations
Explore more demographic insights in this area
Go to Demographics tabPlanning
Planning Constraints
- Flood RiskPremium
- Ramsar Wetland SitesPremium
- Area of Outstanding Natural BeautyPremium
- Protected Nature ReservePremium
- Protected WoodlandPremium