Area Overview for PL1 4HG
Photos of PL1 4HG
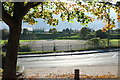
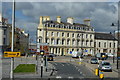
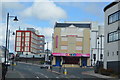
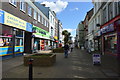
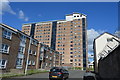
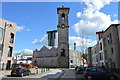
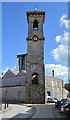
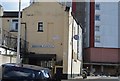
100 photos from this area
Area Information
Key information about the PL1 4HG including its size, population, and administrative classification.
- Area Type
- Postcode
- Area Size
- Not available
- Population
- 1918
- Population Density
- 3672 people/km²
House Prices in PL1 4HG
61
Properties
£67,833
Average Sold Price
£45,500
Lowest Price
£88,000
Highest Price
Showing 61 properties
| Address | Type | Beds | Baths | Last Sale Price | Last Sale Date | |
|---|---|---|---|---|---|---|
| 105, Marlborough House, Granby Way, Plymouth, PL1 4HG | Flat | 1 | 1 | £70,000 | Jul 2024 | |
| 131, Marlborough House, Granby Way, Plymouth, PL1 4HG | Flat | - | - | £88,000 | Jun 2022 | |
| 31, Marlborough House, Granby Way, Plymouth, PL1 4HG | Flat | - | - | £45,500 | Jun 2010 | |
| 29, Marlborough House, Granby Way, Plymouth, PL1 4HG | Flat | - | - | - | - | |
| 69, Marlborough House, Granby Way, Plymouth, PL1 4HG | Flat | - | - | - | - | |
| 61, Marlborough House, Granby Way, Plymouth, PL1 4HG | Flat | - | - | - | - | |
| 73, Marlborough House, Granby Way, Plymouth, PL1 4HG | Flat | - | - | - | - | |
| 53, Marlborough House, Granby Way, Plymouth, PL1 4HG | Flat | - | - | - | - | |
| 51, Marlborough House, Granby Way, Plymouth, PL1 4HG | Flat | - | - | - | - | |
| 49, Marlborough House, Granby Way, Plymouth, PL1 4HG | Flat | - | - | - | - |
Page 1 of 7
Energy Efficiency in PL1 4HG
Amenities
Schools
| Rank | School | Type | Entry gender | Ages |
|---|
Explore more schools in this area
Go to Schools tabDemographics
Household Size
One person
most common
Accommodation Type
Flats
most common
Tenure
22
majority
Ethnic Group
White
most common
Religion
N/A
most common
Household Composition
N/A
most common
Age
47
median
Adults (30-64 years)
most common
Household Deprivation
N/A
with no deprivation
NS-SEC
17
in Lower managerial occupations
Explore more demographic insights in this area
Go to Demographics tabPlanning
Planning Constraints
- Flood RiskPremium
- Ramsar Wetland SitesPremium
- Area of Outstanding Natural BeautyPremium
- Protected Nature ReservePremium
- Protected WoodlandPremium