Area Overview for GL50 3QB
Photos of GL50 3QB
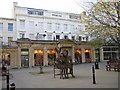
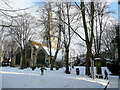
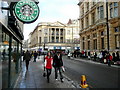
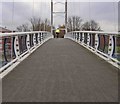
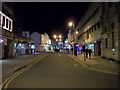
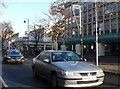
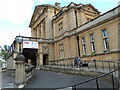
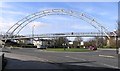
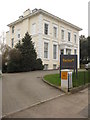

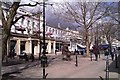
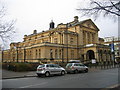
100 photos from this area
Area Information
Key information about the GL50 3QB including its size, population, and administrative classification.
- Area Type
- Postcode
- Area Size
- 1512 m²
- Population
- 1807
- Population Density
- 4626 people/km²
House Prices in GL50 3QB
18
Properties
£405,000
Average Sold Price
£405,000
Lowest Price
£405,000
Highest Price
Showing 18 properties
| Address | Type | Beds | Baths | Last Sale Price | Last Sale Date | |
|---|---|---|---|---|---|---|
| 95 St Georges Place, Cheltenham, GL50 3QB | Land | 1 | 3 | £405,000 | Sep 2018 | |
| Flat 2, 89 St Georges Place, Cheltenham, GL50 3QB | Flat | 1 | 1 | - | - | |
| Flat 4, 89 St Georges Place, Cheltenham, GL50 3QB | Flat | 2 | 2 | - | - | |
| Flat 2, 91 St Georges Place, Cheltenham, GL50 3QB | Flat | - | - | - | - | |
| Flat 5, 89 St Georges Place, Cheltenham, GL50 3QB | Flat | - | - | - | - | |
| Flat 3, 89 St Georges Place, Cheltenham, GL50 3QB | Flat | - | - | - | - | |
| Flat 1, 89 St Georges Place, Cheltenham, GL50 3QB | Flat | 1 | - | - | - | |
| Flat 6, 89 St Georges Place, Cheltenham, GL50 3QB | Flat | - | - | - | - | |
| 87 St Georges Place, Cheltenham, GL50 3QB | Terraced | - | - | - | - | |
| 93 St Georges Place, Cheltenham, GL50 3QB | Office | - | - | - | - |
Page 1 of 2
Energy Efficiency in GL50 3QB
Amenities
Schools
| Rank | School | Type | Entry gender | Ages |
|---|
Explore more schools in this area
Go to Schools tabDemographics
Household Size
One person
most common
Accommodation Type
Flats
most common
Tenure
35
majority
Ethnic Group
White
most common
Religion
N/A
most common
Household Composition
N/A
most common
Age
22
median
Young Adults (15-29 years)
most common
Household Deprivation
N/A
with no deprivation
NS-SEC
40
in Lower managerial occupations
Explore more demographic insights in this area
Go to Demographics tabPlanning
Planning Constraints
- Flood RiskPremium
- Ramsar Wetland SitesPremium
- Area of Outstanding Natural BeautyPremium
- Protected Nature ReservePremium
- Protected WoodlandPremium