Area Overview for Gillingham
Photos of Gillingham
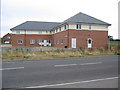
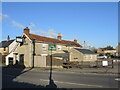
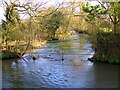
![Gillingham houses [25] in Gillingham](https://images.propbar.co.uk/images/geograph/60/85/6085850_120.jpg)
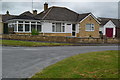
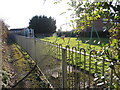
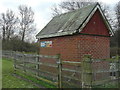
![Gillingham houses [26] in Gillingham](https://images.propbar.co.uk/images/geograph/60/85/6085853_120.jpg)
Area Information
Living in Gillingham means settling into a market town located at 51.0437°N, 2.2843°W within the Blackmore Vale area of North Dorset. This unitary ward covers 31.5 km² and holds a population of 3,171 residents. The area functions as a local farming centre with deep historical roots, first documented in AD 1016. You are stepping back into a town with an unusually sharp sense of time, where Stone Age barrows and Roman settlements sit alongside a 1958 museum and a 1516 grammar school. Daily life revolves around the River Stour and the scenic countryside of the Blackmore Vale. The town features narrow streets lined with timber-framed Tudor buildings and the historic parish church of St Mary the Virgin. You will find yourself in a setting painter John Constable captured in the 1820s, near Gillingham Forest, which was once a royal deer hunting ground. Transport links include the railway station serving the line from London Waterloo to Exeter. The economy relies on agriculture and local trade, now supplemented by industries like brickmaking and cheese production that flourish since the railway arrived in the 1850s. This is a small community where the past remains visibly present on every street corner.
- Area Type
- District Borough Unitary Ward
- Area Size
- 31.5 km²
- Population
- 3171
- Population Density
- 101 people/km²
Demographics
The community profile of Gillingham shows a median age of 70 years. This figure indicates a population dominated by older residents. The most common age range listed in your demographic data is simply noted as 'Age: Total', suggesting a broad distribution where the high median age is the defining characteristic. This data suggests you will join a neighbourhood with an established, older demographic rather than families with young children or commuters during peak years. Home ownership stands at 76 percent within the area. This high rate suggests that the housing stock is largely owned by those who live there. The remaining 24 percent likely comprises the rental market or second homes. Your data does not specify the breakdown of accommodation types by tenure, so you cannot assume a split between private tenants and statutory housing without further detail. The household composition is recorded as a total figure, meaning no specific societal splits such as single-parent households or student living are explicitly detailed here. Consequently, the area feels residential and settled. With a population density of 101 people per km², you will experience a rural feel rather than urban congestion. The predominant ethnic groups and religious affiliations are recorded as totals, meaning you do not have granular data on cultural diversity for this specific analysis. The area is defined by its age profile and high rate of ownership.
Household Size
Accommodation Type
Tenure
Ethnic Group
Religion
Household Composition
Age
Household Deprivation
NS-SEC
Explore more demographic insights in this area
Go to Demographics tabPlanning
Planning Constraints
- Flood RiskPremium
- Ramsar Wetland SitesPremium
- Area of Outstanding Natural BeautyPremium
- Protected Nature ReservePremium
- Crime RiskPremium