Area Overview for Clifton Down Ward
Photos of Clifton Down Ward

Area Information
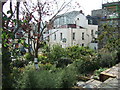
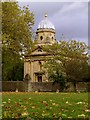
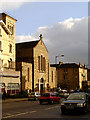
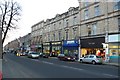
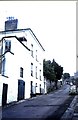
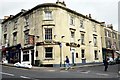
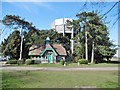
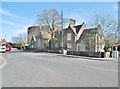
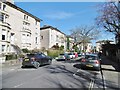
Clifton Down Ward occupies a distinctive landscape within Bristol City Council, covering just over one square kilometre. This ward, established in May 2016, encompasses the preserved public open space north of Clifton village and borders Durdham Down to the north and east. The area is defined by its status as an urban green space, managed specifically for public recreation. You are looking at a location centred at coordinates 51.457684, -2.611404, with the main postcode area being BS8 1BD. The character of Clifton Down Ward stems from its historical origins as common grazing land for the manors of Clifton and Henbury. The Society of Merchant Venturers acquired rights over 230 acres in the late seventeenth century, a move that later enabled the council to purchase Durdham Down. The Clifton and Durdham Downs (Bristol) Act 1861 formally protected this land from development, leading to the creation of the Downs Committee for ongoing management. Today, the ward incorporates scheduled ancient monuments, including the Iron Age fort known as Clifton Down Camp and a Roman road found on neighbouring Durdham Down. A significant historical event occurred here in 1908 when a suffragette meeting drew an attendance of 10,000 people. This legacy of preservation means your daily life in Clifton Down Ward is surrounded by protected woodlands and ancient monuments rather than dense urban sprawl. Nearby, nineteenth-century large houses were constructed for the merchant and professional classes who once dominated the region. You live in an area where historical significance and public access to nature define the modern experience.
- Area Type
- District Borough Unitary Ward
- Area Size
- 1.0 km²
- Population
- Not available
- Population Density
- Not available
Demographics
The community profile of Clifton Down Ward reveals an area with an older demographic compared to many other parts of the country. The median age in Clifton Down Ward stands at 70, indicating a population that is significantly older than the national average. While specific data breaks down the most common age range only as a total indicator, the high median age suggests a settlement populated largely by retirees or long-term residents. Home ownership stands at 39% within the ward boundaries. This figure places Clifton Down Ward in a specific market context where a majority of households likely rent rather than own their property outright. The household composition data aggregates the total population without isolating specific family sizes, yet the high age median implies smaller households or older adults living alone. Accommodation types are similarly summarised in the total records, but the demographic weight points towards housing suitable for later life stages. Ethnic and religious demographics are recorded as totals for the entire ward, reflecting the diverse makeup typical of Bristol without isolating specific percentages for smaller groups. For anyone considering homes in Clifton Down Ward, the low median age is a primary statistic to note. The area is not structured for a young, transient population but rather for those seeking a settled environment. The 39% ownership rate indicates that you will find more long-term residents in Clifton Down Ward than frequent movers. This stability contributes to a neighbourhood where traditions, such as the annual ancient events held on the Downs, have deep roots.
Household Size
Accommodation Type
Tenure
Ethnic Group
Religion
Household Composition
Age
Household Deprivation
NS-SEC
Explore more demographic insights in this area
Go to Demographics tabPlanning
Planning Constraints
- Flood RiskPremium
- Ramsar Wetland SitesPremium
- Area of Outstanding Natural BeautyPremium
- Protected Nature ReservePremium
- Protected WoodlandPremium