Area Overview for Cinderford East Ward
Photos of Cinderford East Ward
Area Information
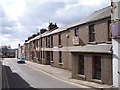
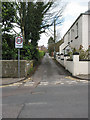
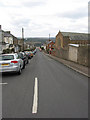
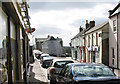
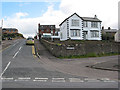
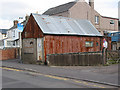
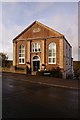
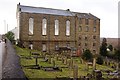
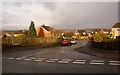
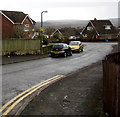
Living in Cinderford East Ward offers a specific type of rural existence defined by its compact footprint. This district borough unitary ward covers just 1.2 km², meaning you move quickly from one end to the other. The area sits within the Cinderford locale, presenting a defined boundary where daily life revolves around close proximity. Your neighbours are likely permanent residents rather than transient occupants, creating a settled environment. This ward represents a slice of the wider Cinderford area, offering a quiet setting where the pace of life remains measured. You will find that the land is intensively used within its small geographic limits. There is no sprawling urban expansion here; instead, the layout reflects a mature, established settlement. For those seeking a home in Cinderford East Ward, the challenge lies in finding space within such a confined zone. The identity of this place is straightforward and unpretentious, focused on function and local history. It avoids the uncertainty of development zones, sticking to a clear, mapped-out reality. This consistency matters to homebuyers who value clarity in their location search. The ward operates as a distinct entity within the broader administrative structure of the unitary authority. Every residential street contributes to a cohesive whole within this one-square-kilometre-plus landscape.
- Area Type
- District Borough Unitary Ward
- Area Size
- 1.2 km²
- Population
- Not available
- Population Density
- Not available
Demographics
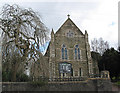
The community residing in Cinderford East Ward is distinctly mature, with a median age of 70. This figure indicates that roughly half the population is older than seventy years. The most common age group encompasses the total age range, yet the central tendency points heavily towards seniors. You are more likely to encounter retirees than young families or early career workers in this ward. Home ownership stands at 71%, a robust figure that signals long-term stability within the neighbourhood. The majority of residents own their property outright or with a significant stake, contrasting sharply with areas dominated by private landlords. This high percentage of owner-occupiers contributes to lower transient rates and a more permanent population structure. Household composition data reflects this older demographic, though specific breakdowns by household type are aggregated under the total category. The area does not show signs of rapid internal migration or youth influx. Ethnic diversity follows the predominant ethnic group trend of the total population, meaning the demographic profile matches wider regional patterns without distinct outliers. Religion statistics also align with the total population figure, suggesting a standard local outlook. For anyone considering homes in Cinderford East Ward, expect a neighbourly but elderly demographic where life moves at a slower pace. The 71% ownership rate ensures that financial distress from repossession is less likely to disrupt the street scene.
Household Size
Accommodation Type
Tenure
Ethnic Group
Religion
Household Composition
Age
Household Deprivation
NS-SEC
Explore more demographic insights in this area
Go to Demographics tabPlanning
Planning Constraints
- Flood RiskPremium
- Ramsar Wetland SitesPremium
- Area of Outstanding Natural BeautyPremium
- Protected Nature ReservePremium
- Protected WoodlandPremium
- Crime RiskPremium