Area Overview for BS7 0TT
Photos of BS7 0TT

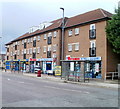
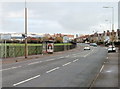
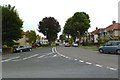
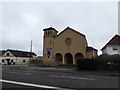

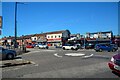
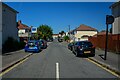
82 photos from this area
Area Information
Key information about the BS7 0TT including its size, population, and administrative classification.
- Area Type
- Postcode
- Area Size
- 1.3 hectares
- Population
- Not available
- Population Density
- Not available
House Prices in BS7 0TT
33
Properties
£282,250
Average Sold Price
£45,500
Lowest Price
£496,000
Highest Price
Showing 33 properties
| Address | Type | Beds | Baths | Last Sale Price | Last Sale Date | |
|---|---|---|---|---|---|---|
| 64 Kenmore Drive, Horfield, Bristol, BS7 0TT | Semi-detached | 3 | 1 | £375,000 | Nov 2024 | |
| 34 Kenmore Drive, Horfield, Bristol, BS7 0TT | house | - | - | £340,000 | Sep 2024 | |
| 32 Kenmore Drive, Horfield, Bristol, BS7 0TT | Terraced | 3 | - | £362,500 | Apr 2024 | |
| 40 Kenmore Drive, Horfield, Bristol, BS7 0TT | house | 3 | 2 | £438,000 | Aug 2023 | |
| 2 Kenmore Drive, Filton, BS7 0TT | Retail | 4 | 1 | £496,000 | Dec 2022 | |
| 52 Kenmore Drive, Horfield, Bristol, BS7 0TT | house | 3 | - | £300,000 | Aug 2022 | |
| 50 Kenmore Drive, Horfield, Bristol, BS7 0TT | house | - | - | £210,800 | Jul 2022 | |
| 48 Kenmore Drive, Horfield, Bristol, BS7 0TT | Detached | 4 | 1 | £315,000 | Jun 2021 | |
| 16 Kenmore Drive, Horfield, Bristol, BS7 0TT | Semi-detached | 4 | 1 | £302,000 | Nov 2020 | |
| 62 Kenmore Drive, Horfield, Bristol, BS7 0TT | Semi-detached | 3 | 1 | £344,444 | Oct 2019 |
Page 1 of 4
Energy Efficiency in BS7 0TT
Amenities
Schools
| Rank | School | Type | Entry gender | Ages |
|---|
Explore more schools in this area
Go to Schools tabDemographics
Household Size
Family (3-5 people)
most common
Accommodation Type
Houses
most common
Tenure
58
majority
Ethnic Group
White
most common
Religion
N/A
most common
Household Composition
N/A
most common
Age
47
median
Adults (30-64 years)
most common
Household Deprivation
N/A
with no deprivation
NS-SEC
37
in Lower managerial occupations
Explore more demographic insights in this area
Go to Demographics tabPlanning
Planning Constraints
- Flood RiskPremium
- Ramsar Wetland SitesPremium
- Area of Outstanding Natural BeautyPremium
- Protected Nature ReservePremium
- Protected WoodlandPremium