Area Overview for TN9 1TL
Photos of TN9 1TL
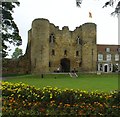
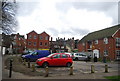
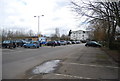
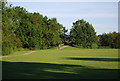
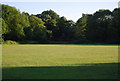
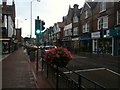
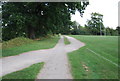
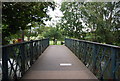
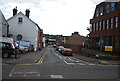
100 photos from this area
Area Information
Key information about the TN9 1TL including its size, population, and administrative classification.
- Area Type
- Postcode
- Area Size
- 3579 m²
- Population
- 2071
- Population Density
- 1422 people/km²
House Prices in TN9 1TL
45
Properties
-
Average Sold Price
-
Lowest Price
-
Highest Price
Showing 45 properties
| Address | Type | Beds | Baths | Last Sale Price | Last Sale Date | |
|---|---|---|---|---|---|---|
| Flat 4, Copper House, 35 Avebury Avenue, Tonbridge, TN9 1TL | Flat | 2 | 1 | - | - | |
| Flat 3, Steel House, 33 Avebury Avenue, Tonbridge, TN9 1TL | Flat | 2 | 1 | - | - | |
| Flat 15, Iron House, 31 Avebury Avenue, Tonbridge, TN9 1TL | Flat | 1 | 1 | - | - | |
| Flat 10, Steel House, 33 Avebury Avenue, Tonbridge, TN9 1TL | Flat | 1 | 1 | - | - | |
| Part Left Block, Enterprise House, Avebury Avenue, Tonbridge, TN9 1TL | Flat | - | - | - | - | |
| Pole Star Publications Limited, 32 Avebury Avenue, Tonbridge, TN9 1TL | office_workshop | - | - | - | - | |
| Tonbridge Osteopathic Clinic, 34 Avebury Avenue, Tonbridge, TN9 1TL | retail_financial | - | - | - | - | |
| The Dairy Cottage, 41 Avebury Avenue, Tonbridge, TN9 1TL | Bungalow | 1 | 1 | - | - | |
| The Dairy Studio, 39 Avebury Avenue, Tonbridge, TN9 1TL | house | 1 | 1 | - | - | |
| Flat 1, 37 Avebury Avenue, Tonbridge, TN9 1TL | Maisonette | - | - | - | - |
Page 1 of 5
Energy Efficiency in TN9 1TL
Amenities
Schools
| Rank | School | Type | Entry gender | Ages |
|---|
Explore more schools in this area
Go to Schools tabDemographics
Household Size
One person
most common
Accommodation Type
Houses
most common
Tenure
54
majority
Ethnic Group
White
most common
Religion
N/A
most common
Household Composition
N/A
most common
Age
47
median
Adults (30-64 years)
most common
Household Deprivation
N/A
with no deprivation
NS-SEC
37
in Lower managerial occupations
Explore more demographic insights in this area
Go to Demographics tabPlanning
Planning Constraints
- Flood RiskPremium
- Ramsar Wetland SitesPremium
- Area of Outstanding Natural BeautyPremium
- Protected Nature ReservePremium
- Protected WoodlandPremium