Area Overview for TN16 1EN
Photos of TN16 1EN
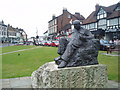
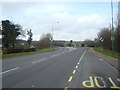
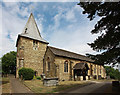
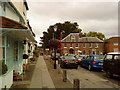
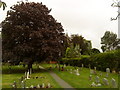
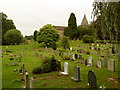
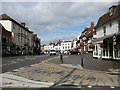
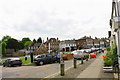
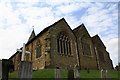

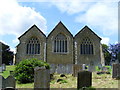
100 photos from this area
Area Information
Key information about the TN16 1EN including its size, population, and administrative classification.
- Area Type
- Postcode
- Area Size
- 3.7 hectares
- Population
- 1738
- Population Density
- 1727 people/km²
House Prices in TN16 1EN
40
Properties
£455,168
Average Sold Price
£87,000
Lowest Price
£1,062,500
Highest Price
Showing 40 properties
| Address | Type | Beds | Baths | Last Sale Price | Last Sale Date | |
|---|---|---|---|---|---|---|
| 32 South Bank, Westerham, TN16 1EN | Semi-detached | 3 | 1 | £485,000 | Jun 2025 | |
| 13 South Bank, Westerham, TN16 1EN | Semi-detached | 3 | 1 | £650,000 | Sep 2024 | |
| 1 South Bank, Westerham, TN16 1EN | Semi-detached | 3 | 2 | £526,000 | Mar 2021 | |
| 36 South Bank, Westerham, TN16 1EN | house | 4 | 2 | £820,000 | Mar 2018 | |
| 14 South Bank, Westerham, TN16 1EN | Semi-detached | 2 | 2 | £399,950 | May 2016 | |
| The Gables, South Bank, Westerham, TN16 1EN | house | 5 | 3 | £1,062,500 | Dec 2015 | |
| Lindau, South Bank, Westerham, TN16 1EN | Detached | 4 | 2 | £770,000 | Aug 2015 | |
| 28 South Bank, Westerham, TN16 1EN | Semi-detached | 3 | 1 | £349,950 | Oct 2014 | |
| 30 South Bank, Westerham, TN16 1EN | Semi-detached | - | - | £300,000 | Jun 2012 | |
| 24 South Bank, Westerham, TN16 1EN | Semi-detached | 3 | 1 | £325,000 | Jul 2011 |
Page 1 of 4
Energy Efficiency in TN16 1EN
Amenities
Schools
| Rank | School | Type | Entry gender | Ages |
|---|
Explore more schools in this area
Go to Schools tabDemographics
Household Size
Family (3-5 people)
most common
Accommodation Type
Houses
most common
Tenure
60
majority
Ethnic Group
White
most common
Religion
N/A
most common
Household Composition
N/A
most common
Age
47
median
Adults (30-64 years)
most common
Household Deprivation
N/A
with no deprivation
NS-SEC
32
in Lower managerial occupations
Explore more demographic insights in this area
Go to Demographics tabPlanning
Planning Constraints
- Flood RiskPremium
- Ramsar Wetland SitesPremium
- Area of Outstanding Natural BeautyPremium
- Protected Nature ReservePremium
- Protected WoodlandPremium