Area Overview for TN12 9RU
Photos of TN12 9RU
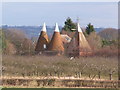
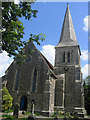
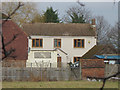
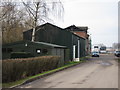
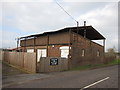
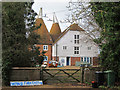
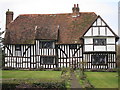
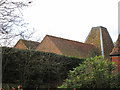
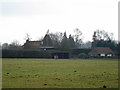
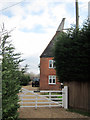
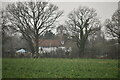
38 photos from this area
Area Information
Key information about the TN12 9RU including its size, population, and administrative classification.
- Area Type
- Postcode
- Area Size
- 3.3 hectares
- Population
- 2338
- Population Density
- 144 people/km²
House Prices in TN12 9RU
9
Properties
£193,907
Average Sold Price
£70,000
Lowest Price
£316,720
Highest Price
Showing 9 properties
| Address | Type | Beds | Baths | Last Sale Price | Last Sale Date | |
|---|---|---|---|---|---|---|
| 1A, Pettits Row, Collier Street, Tonbridge, TN12 9RU | Terraced | 2 | 1 | £316,720 | Sep 2021 | |
| 3, Pettits Row, Collier Street, Tonbridge, TN12 9RU | Terraced | 3 | 1 | £195,000 | Aug 2007 | |
| 2, Pettits Row, Collier Street, Tonbridge, TN12 9RU | house | 2 | - | £70,000 | Sep 1998 | |
| 4, Pettits Row, Collier Street, Tonbridge, TN12 9RU | Terraced | 3 | 1 | - | - | |
| 5, Pettits Row, Collier Street, Tonbridge, TN12 9RU | house | 3 | 1 | - | - | |
| 1, Pettits Row, Collier Street, Tonbridge, TN12 9RU | Terraced | 3 | 1 | - | - | |
| Pettits Barn, Pettits Row, Collier Street, Tonbridge, TN12 9RU | house | 2 | - | - | - | |
| 1, Annexe, Pettits Row, Collier Street, Tonbridge, TN12 9RU | Flat | - | - | - | - | |
| Smiffy Annexe, Pettits Row, 5 Collier Street, Tonbridge, TN12 9RU | Bungalow | - | - | - | - |
Energy Efficiency in TN12 9RU
Amenities
Schools
| Rank | School | Type | Entry gender | Ages |
|---|
Explore more schools in this area
Go to Schools tabDemographics
Household Size
Family (3-5 people)
most common
Accommodation Type
Houses
most common
Tenure
75
majority
Ethnic Group
White
most common
Religion
N/A
most common
Household Composition
N/A
most common
Age
47
median
Adults (30-64 years)
most common
Household Deprivation
N/A
with no deprivation
NS-SEC
43
in Lower managerial occupations
Explore more demographic insights in this area
Go to Demographics tabPlanning
Planning Constraints
- Flood RiskPremium
- Ramsar Wetland SitesPremium
- Area of Outstanding Natural BeautyPremium
- Protected Nature ReservePremium
- Protected WoodlandPremium