Area Overview for SO19 8AG
Photos of SO19 8AG
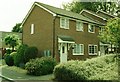
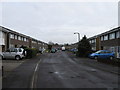
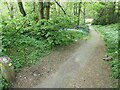
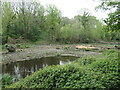
39 photos from this area
Area Information
Key information about the SO19 8AG including its size, population, and administrative classification.
- Area Type
- Postcode
- Area Size
- 4456 m²
- Population
- 1606
- Population Density
- 5014 people/km²
House Prices in SO19 8AG
10
Properties
£169,875
Average Sold Price
£69,000
Lowest Price
£267,000
Highest Price
Showing 10 properties
| Address | Type | Beds | Baths | Last Sale Price | Last Sale Date | |
|---|---|---|---|---|---|---|
| 3 Pembroke Road, Southampton, SO19 8AG | Bungalow | - | - | £267,000 | Jun 2023 | |
| 7 Pembroke Road, Southampton, SO19 8AG | Bungalow | 2 | - | £220,000 | Sep 2014 | |
| 8 Pembroke Road, Southampton, SO19 8AG | Bungalow | - | - | £172,500 | Dec 2013 | |
| 12 Pembroke Road, Southampton, SO19 8AG | Bungalow | - | - | £150,000 | Jan 2012 | |
| 6 Pembroke Road, Southampton, SO19 8AG | Semi-detached | 2 | 1 | £155,000 | May 2011 | |
| 10 Pembroke Road, Southampton, SO19 8AG | Bungalow | - | - | £185,500 | Aug 2010 | |
| 4 Pembroke Road, Southampton, SO19 8AG | Semi-detached | - | - | £140,000 | Feb 2003 | |
| 1 Pembroke Road, Southampton, SO19 8AG | Semi-detached | - | - | £69,000 | Oct 1998 | |
| 5 Pembroke Road, Southampton, SO19 8AG | Semi-detached | - | - | - | - | |
| 2 Pembroke Road, Southampton, SO19 8AG | Semi-detached | - | - | - | - |
Energy Efficiency in SO19 8AG
Amenities
Schools
| Rank | School | Type | Entry gender | Ages |
|---|
Explore more schools in this area
Go to Schools tabDemographics
Household Size
Two person
most common
Accommodation Type
Houses
most common
Tenure
75
majority
Ethnic Group
White
most common
Religion
N/A
most common
Household Composition
N/A
most common
Age
47
median
Adults (30-64 years)
most common
Household Deprivation
N/A
with no deprivation
NS-SEC
29
in Lower managerial occupations
Explore more demographic insights in this area
Go to Demographics tabPlanning
Planning Constraints
- Flood RiskPremium
- Ramsar Wetland SitesPremium
- Area of Outstanding Natural BeautyPremium
- Protected Nature ReservePremium
- Protected WoodlandPremium